advertisement

APPENDIX P – SOUND RESULTS
100%
90%
80%
70%
60%
50%
40%
30%
20%
10%
0%
1
2
3
4
5
Building ID
6
7
8
9
10
Close door
Don't close door
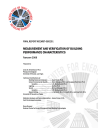
Figure P99. Summary of occupants’ responses on the perception questionnaire concerning closing of a door to gain privacy in their work area.
NCEMBT-080201 343
APPENDIX Q- SOUND LEVEL DATA
APPENDIX Q- SOUND LEVEL DATA
Summary of Calculated Values.
Q1.
D BA B UMPS
These data are used to describe sound level measurements for various frequencies that exceed the levels of their immediate neighbors by the variances shown below. Items that equal or exceed the variance are identified with the value of 1 otherwise they contain the value of zero.
Description Field Name Columns
1/1 octave band, 4dB variance
1/1 octave band, 6dB variance
1/1 octave band, 8dB variance
1/3 octave band, 4dB variance
1/3 octave band, 6dB variance
1/3 octave band, 8dB variance
DBA11_63_6 through DB11_4000_4
DBA11_63_6 through DB11_4000_6
DBA11_63_6 through DB11_4000_8
DBA13_63_6 through DB13_8000_4
DBA13_63_6 through DB13_8000_6
DBA13_63_6 through DB13_8000_8
7
7
7
22
22
22
Q2.
D BC
See SPL_C in raw data (Float)
Q3.
D BC D BA
Use SPL_C - SPL_A in raw data (Float)
Q4.
NC – N OISE C RITERIA
NC selects the highest measured sound level that fits within a standardized sound level.
NCMax stores the maximum sound level found. (Float)
NCFreq stores the frequency where this sound level was found. (Integer)
Q5.
NCB – B ALANCED N OISE C RITERIA
NCB is one method to determine if rumble and hiss exist in a sound sample.
SIL stores the Sound Interface Level used to select the NCB reference level for rumble (Float)
NCBRumble stores a 1 if rumble is detected otherwise a 0 (Integer)
NCBRefHiss stores the NCB reference level for hiss (Integer)
NCBHiss stores a 1 if hiss is detected otherwise 0 (Integer)
344 NCEMBT-080201
APPENDIX Q- SOUND LEVEL DATA
Q6.
RC – R
OOM
C
RITERIA
RC stores the RC table level that is used for analyzing hiss and rumble (Float)
RCRumble stores a 1 if rumble is detected otherwise a 0 (Integer)
RCHiss stores a 1 if hiss is detected otherwise a 0 (Integer)
Q7.
RC M ARK II (RCII) A LTERNATE R OOM CRITERIA
RCII is another derivative that analyzes rumble, hiss and an intermediate quality descriptor named roar.
RCII stores the RC table level that is used for analyzing hiss, rumble and roar (Integer)
DeltaLF stores a cumulative difference between the table and the measured low freq values (Float)
DeltaMF stores a cumulative difference between the table and the measured med freq values (Float)
DeltaHF stores a cumulative difference between the table and the measured high freq values (Float)
RCIIQual stores the indicator for the highest Delta, 0=none, 1=LF, 2=MF, 3=HF, whenever DeltaMax is greater than 5 (Integer)
DeltaMax (QAI) stores the largest difference between any pair of Deltas above (Float)
Q8.
C
UMULATIVE
P
ROBABILITY
L
EVELS
(CPL)
CPL defines a level for a measurement where a specified percentage of the samples fall at or below the indicated percentage. The following table shows how to construct the 8 field names for the each of the four measurements, dBA, dBC, dBC_dBA, NCMax, RC and SIL:
Prefix
L_99_
L_95_
L_90_
L_80_
L_50_
L_33_
L_10_
L_05_
Suffixes dBA dBA dBA dBA dBA dBA dBA dBA dBC dBC dBC dBC dBC dBC dBC dBC dBC_dBA dBC_dBA dBC_dBA dBC_dBA dBC_dBA dBC_dBA dBC_dBA dBC_dBA
dBA is raw SPL_A data taken form the samples (Float)
NCMax
NCMax
NCMax
NCMax
NCMax
NCMax
NCMax
NCMax
RC
RC
RC
RC
RC
RC
RC
RC
dBA is raw SPL_C data taken form the samples (Float)
dBA_dBA is raw SPL_C minus the raw SLP_A data taken form the samples (Float)
SIL
SIL
SIL
SIL
SIL
SIL
SIL
SIL
NCMax is the calculated sound level from the NC sections above (Float)
RC is the value stored in the RC sections above (Float)
SIL is the value stored in the NCB sections above (Float)
NCEMBT-080201 345
APPENDIX Q- SOUND LEVEL DATA
Factor
Building
Zone
Sampling Date
Residual
Building
Zone
Sampling Date
Residual
Building
Zone
Sampling Date
Residual
Building
Zone
Sampling Date
Residual
Building
Zone
Sampling Date
Residual
Q9.
C
OVARIANCE
I
N
S
OUND
M
EASUREMENTS
U
SING
A
NALYSIS
O
F
C
OVARIANCE
(A
NCOVA
)
Table Q1. Variance in sound interference level (SIL) measurements.
Sound Measure
L_95_SIL
Percentage
10%
L_95_SIL
L_95_SIL
L_95_SIL
L_90_SIL
L_90_SIL
L_90_SIL
L_90_SIL
79%
10%
0%
15%
71%
15%
0%
L_80_SIL
L_80_SIL
L_80_SIL
L_80_SIL
L_50_SIL
L_50_SIL
L_50_SIL
L_50_SIL
L_10_SIL
L_10_SIL
L_10_SIL
L_10_SIL
16%
67%
16%
0%
19%
62%
19%
0%
27%
46%
27%
0%
346 NCEMBT-080201
Factor
Building
Zone
Sampling Date
Residual
Building
Zone
Sampling Date
Residual
Building
Zone
Sampling Date
Residual
Building
Zone
Sampling Date
Residual
Building
Zone
Sampling Date
Residual
Building
Zone
Sampling Date
Residual
APPENDIX Q- SOUND LEVEL DATA
Table Q2. Variance in sound dBA measurements.
Sound Measure
L_99_dBA
L_99_dBA
L_99_dBA
L_99_dBA
L_95_dBA
L_95_dBA
L_95_dBA
L_95_dBA
L_90_dBA
L_90_dBA
L_90_dBA
L_90_dBA
L_80_dBA
L_80_dBA
L_80_dBA
L_80_dBA
L_50_dBA
L_50_dBA
L_50_dBA
L_50_dBA
L_10_dBA
L_10_dBA
L_10_dBA
L_10_dBA
17%
66%
17%
0%
22%
56%
22%
0%
31%
37%
31%
0%
11%
79%
11%
0%
14%
72%
14%
0%
Percentage
11%
78%
11%
0%
NCEMBT-080201 347
Factor
Building
Zone
Sampling Date
Residual
Building
Zone
Sampling Date
Residual
Building
Zone
Sampling Date
Residual
Building
Zone
Sampling Date
Residual
Building
Zone
Sampling Date
Residual
Building
Zone
Sampling Date
Residual
Building
Zone
Sampling Date
Residual
Building
Zone
Sampling Date
Residual
APPENDIX Q- SOUND LEVEL DATA
Table Q3. Variance in sound NC max and RC measurements.
Sound Measure Percentage
L_90_NCMax 11%
L_90_NCMax
L_90_NCMax
L_90_NCMax
L_80_NCMax
77%
11%
0%
14%
L_80_NCMax
L_80_NCMax
L_80_NCMax
L_50_NCMax
72%
14%
0%
17%
L_80_RC
L_80_RC
L_50_RC
L_50_RC
L_50_RC
L_50_RC
L_10_RC
L_10_RC
L_10_RC
L_10_RC
L_50_NCMax
L_50_NCMax
L_50_NCMax
L_10_NCMax
L_10_NCMax
L_10_NCMax
L_10_NCMax
L_90_RC
L_90_RC
L_90_RC
L_90_RC
L_80_RC
L_80_RC
19%
0%
28%
44%
28%
0%
15%
0%
19%
62%
0%
14%
73%
13%
0%
15%
69%
66%
17%
0%
29%
42%
29%
348 NCEMBT-080201
APPENDIX Q- SOUND LEVEL DATA
Q10.
S
TATISTICAL
R
ESULTS
I
N
C
OMPARISON
O
F
S
OUND
M
EASUREMENTS
W
ITH
A
NSWERS
T
O
T HE O CCUPANT P ERCEPTION Q UESTIONNAIRE F OR T HE Q UESTION “O VER T HE L AST F OUR
W EEKS I W OULD R ATE T HE S OUND O R N OISE I N M Y W ORK A REA A S A CCEPTABLE ”
(Type = statistical analysis performed; Corr = correlation, yellow highlight = significant [p<0.05]; green highlight = moderately significant [0.05<p<0.075]).
Table Q4. Statistical results in comparison of sound measurements with answers to the occupant perception questionnaire for the question “over the last four weeks i would rate the sound or noise in my work area as acceptable” for building 1.
Variable
L_5_dBA
L_5_dBA
Type
Pearson
Spearman
Corr
0.639205
0.619471 p value
0.087935
0.101431
L_5_dBC
L_5_dBC
L_50_dBA
L_50_dBA
Pearson
Spearman
Pearson
Spearman
0.128336
0.114708
0.746249
0.210132
0.761998
0.786802
0.033468
0.418226
L_50_dBC
L_50_dBC
L_95_dBA
L_95_dBA
L_95_dBC
L_95_dBC
Pearson
Spearman
Pearson
Spearman
Pearson
Spearman
0.105442
-0.25811
0.062286
0.361358
0.109636
-0.25811
0.803756
0.537104
0.883515
0.379126
0.796075
0.537104
Table Q5. Statistical results in comparison of sound measurements with answers to the occupant perception questionnaire for the question “over the last four weeks i would rate the sound or noise in my work area as acceptable” for building 2.
Variable Type Corr p value
L_5_dBA
L_5_dBA
L_5_dBC
L_5_dBC
Pearson
Spearman
Pearson
Spearman
-0.39671
-0.5631
-0.10623
-0.31739
0.378247
0.188095
0.820675
0.487912
L_50_dBA
L_50_dBA
L_50_dBC
L_50_dBC
L_95_dBA
L_95_dBA
L_95_dBC
L_95_dBC
Pearson
Spearman
Pearson
Spearman
Pearson
Spearman
Pearson
Spearman
-0.34165
-0.5631
-0.04385
0.133097
-0.41458
-0.15357
0.120842
0.133097
0.453239
0.188095
0.925625
0.776043
0.355073
0.742349
0.796347
0.776043
NCEMBT-080201 349
APPENDIX Q- SOUND LEVEL DATA
Table Q6 Statistical results in comparison of sound measurements with answers to the occupant perception questionnaire for the question “over the last four weeks i would rate the sound or noise in my work area as acceptable” for building 3.
Variable Type Corr p value
L_5_dBA
L_5_dBA
L_5_dBC
L_5_dBC
L_50_dBA
Pearson
Spearman
Pearson
Spearman
Pearson
-0.69816
-0.74245
-0.41509
-0.22321
-0.73015
0.005488
0.002356
0.13997
0.443039
0.003026
L_50_dBA
L_50_dBC
L_50_dBC
L_95_dBA
L_95_dBA
L_95_dBC
L_95_dBC
Spearman
Pearson
Spearman
Pearson
Spearman
Pearson
Spearman
-0.75287
-0.39065
-0.22321
-0.73632
-0.73017
-0.34187
-0.21213
0.001885
0.167271
0.443039
0.002673
0.003025
0.231548
0.466578
Table Q7. Statistical results in comparison of sound measurements with answers to the occupant perception questionnaire for the question “over the last four weeks i would rate the sound or noise in my work area as acceptable” for building 4.
Variable
L_5_dBA
L_5_dBA
Type
Pearson
Spearman
Corr
0
0.067598 p value
1
0.796577
L_5_dBC
L_5_dBC
L_50_dBA
L_50_dBA
Pearson
Spearman
Pearson
Spearman
0.18531
0.043972
0.210132
0.243486
0.476429
0.866921
0.418226
0.346332
L_50_dBC
L_50_dBC
L_95_dBA
L_95_dBA
L_95_dBC
L_95_dBC
Pearson
Spearman
Pearson
Spearman
Pearson
Spearman
0.247365
0.049222
0.079523
-0.04397
0.204531
0.040034
0.338458
0.851188
0.761593
0.866921
0.431019
0.878752
Table Q8. Statistical results in comparison of sound measurements with answers to the occupant perception questionnaire for the question “over the last four weeks i would rate the sound or noise in my work area as acceptable” for building 5.
Variable Type Corr p value
L_5_dBA
L_5_dBA
L_5_dBC
L_5_dBC
Pearson
Spearman
Pearson
Spearman
-0.14587
-0.00837
0.016599
-0.00328
0.528104
0.971274
0.943068
0.988757
L_50_dBA
L_50_dBA
L_50_dBC
L_50_dBC
L_95_dBA
L_95_dBA
L_95_dBC
L_95_dBC
Pearson
Spearman
Pearson
Spearman
Pearson
Spearman
Pearson
Spearman
-0.10733
0.038214
0.023185
-0.01492
0
0.059322
0.023769
-0.02366
0.643321
0.869374
0.920538
0.948815
1
0.798394
0.918543
0.91893
350 NCEMBT-080201
APPENDIX Q- SOUND LEVEL DATA
Table Q9. Statistical results in comparison of sound measurements with answers to the occupant perception questionnaire for the question “over the last four weeks i would rate the sound or noise in my work area as acceptable” for building 6.
Variable
L_5_dBA
Type
Pearson
Corr
0.219742 p value
0.142282
L_5_dBA
L_5_dBC
L_5_dBC
L_50_dBA
Spearman
Pearson
Spearman
Pearson
0.133436
0.238694
0.279094
0.163888
0.376663
0.110147
0.060337
0.276449
L_50_dBA
L_50_dBC
L_50_dBC
L_95_dBA
L_95_dBA
L_95_dBC
L_95_dBC
Spearman
Pearson
Spearman
Pearson
Spearman
Pearson
Spearman
0.097841
0.23607
0.279094
0.097429
0.146653
0.226883
0.213297
0.517709
0.114231
0.060337
0.519480
0.330777
0.129444
0.154656
Table Q10 Statistical results in comparison of sound measurements with answers to the occupant perception questionnaire for the question “over the last four weeks i would rate the sound or noise in my work area as acceptable” for building 7.
Variable
L_5_dBA
L_5_dBA
Type
Pearson
Spearman
Corr
0.046887
0.071886 p value
0.644906
0.479512
L_5_dBC
L_5_dBC
L_50_dBA
L_50_dBA
Pearson
Spearman
Pearson
Spearman
0.010774
-0.10362
0.17181
0.153721
0.915707
0.307436
0.089047
0.128731
L_50_dBC
L_50_dBC
L_95_dBA
L_95_dBA
L_95_dBC
L_95_dBC
Pearson
Spearman
Pearson
Spearman
Pearson
Spearman
-0.0343
-0.13694
0.124047
0.204069
0.025119
0.054596
0.736088
0.176491
0.221213
0.04276
0.805063
0.591458
Table Q11. Statistical results in comparison of sound measurements with answers to the occupant perception questionnaire for the question “over the last four weeks i would rate the sound or noise in my work area as acceptable” for building 8.
Variable Type Corr p value
L_5_dBA
L_5_dBA
L_5_dBC
L_5_dBC
Pearson
Spearman
Pearson
Spearman
-0.06888
0.010233
0.222894
0.23667
0.668707
0.949371
0.161281
0.136272
L_50_dBA
L_50_dBA
L_50_dBC
L_50_dBC
L_95_dBA
L_95_dBA
L_95_dBC
L_95_dBC
Pearson
Spearman
Pearson
Spearman
Pearson
Spearman
Pearson
Spearman
-0.00492
-0.01993
0.221158
0.23667
-0.11601
-0.09162
-0.05285
-0.02029
0.975651
0.901584
0.164655
0.136272
0.470092
0.56889
0.742799
0.899819
NCEMBT-080201 351
APPENDIX Q- SOUND LEVEL DATA
Table Q12. Statistical results in comparison of sound measurements with answers to the occupant perception questionnaire for the question “over the last four weeks i would rate the sound or noise in my work area as acceptable” for building 9.
Variable
L_5_dBA
Type
Pearson
Corr
-0.0447 p value
0.736734
L_5_dBA
L_5_dBC
L_5_dBC
L_50_dBA
Spearman
Pearson
Spearman
Pearson
0.07874
0.15512
0.16788
0.06712
0.553344
0.240743
0.203739
0.613506
L_50_dBA
L_50_dBC
L_50_dBC
L_95_dBA
L_95_dBA
L_95_dBC
L_95_dBC
Spearman
Pearson
Spearman
Pearson
Spearman
Pearson
Spearman
0.16788
0.09462
0.07874
0.23425
0.24865
0.17201
-0.103
0.203739
0.475939
0.553344
0.074134
0.057561
0.192679
0.437593
Table Q13. Statistical results in comparison of sound measurements with answers to the occupant perception questionnaire for the question “over the last four weeks i would rate the sound or noise in my work area as acceptable” for building 10.
Variable
L_5_dBA
Type
Pearson
Corr
0.147992 p value
0.205115
L_5_dBA
L_5_dBC
Spearman
Pearson
0.145156
0.125206
0.214029
0.284475
L_5_dBC
L_50_dBA
L_50_dBA
L_50_dBC
L_50_dBC
L_95_dBA
L_95_dBA
L_95 _dBC
L_95 _dBC
Spearman
Pearson
Spearman
Pearson
Spearman
Pearson
Spearman
Pearson
Spearman
0.145156
0.131565
0.157931
0.121706
0.145156
0.004386
0.00162
0.122608
0.139107
0.214029
0.260526
0.175973
0.298259
0.214029
0.970206
0.988996
0.294665
0.233942
352 NCEMBT-080201
APPENDIX Q- SOUND LEVEL DATA
Q11.
S
TATISTICAL
R
ESULTS
I
N
C
OMPARISON
O
F
S
OUND
M
EASUREMENTS
I
N
W
ITH
A
NSWERS
T O T HE O CCUPANT P ERCEPTION Q UESTIONNAIRE F OR T HE Q UESTION “T HROUGHOUT T HE
C OURSE O F T HE E NTIRE W ORKDAY , T HE S OUNDS O R N OISE I N M Y W ORK A REA F LUCTUATES ”
7
7
6
6
5
5
4
4
Bldg ID
1
1
3
3
2
2
9
9
8
8
10
10
(Type = statistical analysis performed; Corr = correlation, yellow highlight = significant [p<0.05]; green highlight = moderately significant [0.05<p<0.075]).
Table Q14. Pearson and Spearman Tests Results for Individual Buildings
Type Corr
Pearson
Spearman
0.285779
0.258113
Pearson
Spearman
Pearson
Spearman
0.292009
0.048086
-0.16162
0.039647
Pearson
Spearman
Pearson
Spearman
Pearson
Spearman
Pearson
Spearman
0.553256
0.525468
-0.14598
-0.16042
0.111175
0.105222
0.013732
0.069466
Pearson
Spearman
Pearson
Spearman
Pearson
Spearman
-0.07197
0.016214
0.039309
0.045759
0.130723
0.13318 p value
0.492624
0.537104
0.525133
0.918461
0.580941
0.892955
0.021237
0.030296
0.52779
0.487267
0.462
0.486463
0.89269
0.494466
0.65478
0.919855
0.767543
0.73074
0.263615
0.254668
NCEMBT-080201 353
APPENDIX Q- SOUND LEVEL DATA
Q12.
S
TATISTICAL
R
ESULTS
I
N
C
OMPARISON
O
F
S
OUND
M
EASUREMENTS
W
ITH
A
NSWERS
T
O
T HE O CCUPANT P ERCEPTION Q UESTIONNAIRE F OR T HE Q UESTION “I H EAR S OUNDS F ROM
O UTSIDE T HE B UILDING (A IRPLANES , T RAFFIC , T RAINS , C ONSTRUCTION , M ECHANICAL
E QUIPMENT , S IRENS , E TC .) I N M Y W ORK A REA ”
(SndOSHear) with follow on questions concerning the sound affecting productivity (SndOSProdAffect), if the sound was annoying/distracting (SndOSAnnoy), and how soon the annoyance/distraction occurred
(SndOSDistrWithin) and for how long (SndOSDistrFor) the annoyance/distraction continued
(Type = statistical analysis performed; Corr = correlation, yellow highlight = significant [p<0.05]; green highlight = moderately significant [0.05<p<0.075]).
Table Q15. Statistical results in comparison of sound measurements with answers to the occupant perception questionnaire for the question “i hear sounds from outside the building (airplanes, traffic, trains, construction, mechanical equipment, sirens, etc.) in my work area” for building 1.
Variable
SndOSHear
SndOSHear
Type
Pearson
Spearman
Corr
-0.35642
-0.45004 p value
0.386147
0.263195
SndOSProdAffect
SndOSProdAffect
SndOSAnnoy
Pearson
Spearman
Pearson
-0.24961
-0.2905
-0.22601
0.551056
0.485186
0.590436
SndOSAnnoy
SndOSDistrWithin
SndOSDistrWithin
SndOSDistrFor
SndOSDistrFor
Spearman
Pearson
Spearman
Pearson
Spearman
0.063786
0.118435
0.131165
0.16912
0.290323
0.880724
0.823178
0.804381
0.748738
0.576751
Table Q16. Statistical results in comparison of sound measurements with answers to the occupant perception questionnaire for the question “i hear sounds from outside the building (airplanes, traffic, trains, construction, mechanical equipment, sirens, etc.) in my work area” for building 2.
Variable
SndOSHear
SndOSHear
Type
Pearson
Spearman
Corr
0.246018
0.285727 p value
0.594871
0.53449
SndOSProdAffect
SndOSProdAffect
SndOSAnnoy
Pearson
Spearman
Pearson
0.928593
0.783349
0.894459
0.007466
0.065322
0.016120
SndOSAnnoy
SndOSDistrWithin
SndOSDistrWithin
SndOSDistrFor
SndOSDistrFor
Spearman
Pearson
Spearman
Pearson
Spearman
0.783349
-1
-1
-1
-1
0.065322
354 NCEMBT-080201
APPENDIX Q- SOUND LEVEL DATA
Table Q17. Statistical results in comparison of sound measurements with answers to the occupant perception questionnaire for the question “i hear sounds from outside the building (airplanes, traffic, trains, construction, mechanical equipment, sirens, etc.) in my work area” for building 3.
Variable
SndOSHear
Type
Pearson
Corr
-0.18333 p value
0.530418
SndOSHear
SndOSAnnoy
SndOSAnnoy
SndOSProdAffect
Spearman
Pearson
Spearman
Pearson
-0.75000
0.148109
-0.04444
0.239423
0.002006
0.683025
0.90297
0.505266
SndOSProdAffect
SndOSDistrWithin
SndOSDistrWithin
SndOSDistrFor
SndOSDistrFor
Spearman
Pearson
Spearman
Pearson
Spearman
0.026836
-0.30877
-0.65727
-0.21093
-0.42426
0.941339
0.551565
0.156069
0.688298
0.401788
Table Q18. Statistical results in comparison of sound measurements with answers to the occupant perception questionnaire for the question “i hear sounds from outside the building (airplanes, traffic, trains, construction, mechanical equipment, sirens, etc.) in my work area” for building g 4.
Variable Type Corr p value
SndOSHear
SndOSHear
SndOSAnnoy
SndOSAnnoy
Pearson
Spearman
Pearson
Spearman
0.056954
0.124274
0.151389
0.266391
0.828117
0.634634
0.605417
0.357257
SndOSProdAffect
SndOSProdAffect
SndOSDistrWithin
SndOSDistrWithin
SndOSDistrFor
SndOSDistrFor
Pearson
Spearman
Pearson
Spearman
Pearson
Spearman
0.111374
0.198380
0.204424
0.153624
0.252947
0.310517
0.704649
0.496586
0.571046
0.671766
0.480742
0.382536
Table Q19. Statistical results in comparison of sound measurements with answers to the occupant perception questionnaire for the question “i hear sounds from outside the building (airplanes, traffic, trains, construction, mechanical equipment, sirens, etc.) in my work area” for building 5.
Variable Type Corr p value
SndOSHear
SndOSHear
SndOSAnnoy
SndOSAnnoy
Pearson
Spearman
Pearson
Spearman
0.18592
0.21749
0.19768
0.24749
0.419738
0.343618
0.431709
0.322104
SndOSProdAffect
SndOSProdAffect
SndOSDistrWithin
SndOSDistrWithin
SndOSDistrFor
SndOSDistrFor
Pearson
Spearman
Pearson
Spearman
Pearson
Spearman
-0.3944
-0.3962
0.20705
0.09805
0.15573
0.09415
0.105319
0.103589
0.441644
0.717914
0.564671
0.728711
NCEMBT-080201 355
APPENDIX Q- SOUND LEVEL DATA
Table Q20. Statistical results in comparison of sound measurements with answers to the occupant perception questionnaire for the question “i hear sounds from outside the building (airplanes, traffic, trains, construction, mechanical equipment, sirens, etc.) in my work area” for building 6.
Variable
SndOSHear
Type
Pearson
Corr
-0.11632 p value
0.441416
SndOSHear
SndOSAnnoy
SndOSAnnoy
SndOSProdAffect
Spearman
Pearson
Spearman
Pearson
-0.19947
-0.21812
-0.25174
-0.11479
0.183840
0.264821
0.196268
0.560804
SndOSProdAffect
SndOSDistrWithin
SndOSDistrWithin
SndOSDistrFor
SndOSDistrFor
Spearman
Pearson
Spearman
Pearson
Spearman
0.039172
-0.39221
-0.28968
-0.43312
-0.39974
0.843120
0.119449
0.259398
0.082443
0.111895
Table Q21 Statistical results in comparison of sound measurements with answers to the occupant perception questionnaire for the question “i hear sounds from outside the building (airplanes, traffic, trains, construction, mechanical equipment, sirens, etc.) in my work area” for building 7.
Variable Type Corr p value
SndOSHear
SndOSHear
SndOSAnnoy
SndOSAnnoy
Pearson
Spearman
Pearson
Spearman
0.235489
0.144126
0.057356
0.044391
0.018954
0.154660
0.613314
0.695805
SndOSProdAffect
SndOSProdAffect
SndOSDistrWithin
SndOSDistrWithin
SndOSDistrFor
SndOSDistrFor
Pearson
Spearman
Pearson
Spearman
Pearson
Spearman
-0.06697
-0.06507
-0.15470
-0.08227
-0.08671
-0.07440
0.555058
0.566329
0.246263
0.539262
0.517497
0.578881
Table Q22. Statistical results in comparison of sound measurements with answers to the occupant perception questionnaire for the question “i hear sounds from outside the building (airplanes, traffic, trains, construction, mechanical equipment, sirens, etc.) in my work area” for building 8.
Variable Type Corr p value
SndOSHear
SndOSHear
SndOSAnnoy
SndOSAnnoy
Pearson
Spearman
Pearson
Spearman
-0.32372
-0.42313
-0.22930
-0.18998
0.038954
0.005845
0.317387
0.409465
SndOSProdAffect
SndOSProdAffect
SndOSDistrWithin
SndOSDistrWithin
SndOSDistrFor
SndOSDistrFor
Pearson
Spearman
Pearson
Spearman
Pearson
Spearman
-0.05114
-0.07136
-0.11809
-0.02937
0.081203
0.134923
0.825764
0.758568
0.700799
0.924111
0.792000
0.660319
356 NCEMBT-080201
APPENDIX Q- SOUND LEVEL DATA
Table Q23. Statistical results in comparison of sound measurements with answers to the occupant perception questionnaire for the question “i hear sounds from outside the building (airplanes, traffic, trains, construction, mechanical equipment, sirens, etc.) in my work area” for building 9.
Variable
SndOSHear
Type
Pearson
Corr
-0.43795 p value
0.000523
SndOSHear
SndOSAnnoy
SndOSAnnoy
SndOSProdAffect
Spearman
Pearson
Spearman
Pearson
-0.29396
0.090919
0.216704
-0.15491
0.023833
0.557239
0.157678
0.315369
SndOSProdAffect
SndOSDistrWithin
SndOSDistrWithin
SndOSDistrFor
SndOSDistrFor
Spearman
Pearson
Spearman
Pearson
Spearman
-0.05635
-0.03095
0.090978
-0.05348
0.052284
0.716351
0.862068
0.608854
0.763874
0.769017
Table Q24. Statistical results in comparison of sound measurements with answers to the occupant perception questionnaire for the question “i hear sounds from outside the building (airplanes, traffic, trains, construction, mechanical equipment, sirens, etc.) in my work area” for building 10.
Variable Type Corr p value
SndOSHear
SndOSHear
SndOSAnnoy
SndOSAnnoy
Pearson
Spearman
Pearson
Spearman
-0.11841
-0.11690
-0.00589
0.075250
0.311622
0.317899
0.974896
0.687442
SndOSProdAffect
SndOSProdAffect
SndOSDistrWithin
SndOSDistrWithin
SndOSDistrFor
SndOSDistrFor
Pearson
Spearman
Pearson
Spearman
Pearson
Spearman
-0.25493
-0.22206
0.326046
0.287187
0.197818
0.241364
0.166344
0.229896
0.119978
0.173613
0.354147
0.255868
NCEMBT-080201 357
APPENDIX Q- SOUND LEVEL DATA
Bldg ID
1
1
2
5
6
4
5
3
4
2
3
8
9
9
10
7
8
6
7
10
Q13.
S
TATISTICAL
R
ESULTS
I
N
C
OMPARISON
O
F
S
OUND
M
EASUREMENTS
A
ND
T
HE
C
AUSE
O F T HE S OUND D ISTRACTION
(Bldg ID = building identification; Type = statistical analysis performed; Corr = correlation, yellow highlight = significant [p<0.05]; green highlight = moderately significant [0.05<p<0.075]; n/a = not applicable as there were no responses to this question).
Table Q25. Results for “too loud” and L_99 minus L_50 for dBA.
Type Corr
Pearson
Spearman
Pearson
0.161394
0.454699
0.567634
Spearman
Pearson
Spearman
Pearson
Spearman
Pearson
Spearman
Pearson
0.524554 n/a n/a
0.513297
0.507651
0.104163
0.099449
-0.18179
Spearman
Pearson
Spearman
Pearson
Spearman
Pearson
Spearman
Pearson
Spearman
-0.19589
-0.16368
-0.18448
0.142476
0.165128
-0.13568
-0.04655
-0.05682
-0.05186 p value
0.702600
0.257663
0.183780
0.226767 n/a n/a
0.035091
0.037502
0.653192
0.668001
0.226610
0.192001
0.105484
0.067561
0.374204
0.302195
0.305546
0.726243
0.628261
0.658582
358 NCEMBT-080201
APPENDIX Q- SOUND LEVEL DATA
7
7
6
6
5
5
4
4
Bldg ID
1
1
3
3
2
2
9
9
8
8
10
10
6
6
5
5
4
4
3
3
Bldg ID
2
2
1
1
9
9
10
10
8
8
7
7
Table Q26. Results for “intermittent/unpredictable” and L_95 minus L_50 for dBA.
Type Corr p value
Pearson
Spearman
Pearson
Spearman
0.093056
0.255146 n/a n/a
0.826524
0.541958 n/a n/a
Pearson
Spearman
Pearson
Spearman
Pearson
Spearman
Pearson
Spearman
0.094299
-0.01972
-0.23703
-0.17186
-0.19470
-0.13229
0.050315
-0.05076
0.748473
0.946651
0.359665
0.509531
0.397699
0.567580
0.739833
0.737611
Pearson
Spearman
Pearson
Spearman
Pearson
Spearman
Pearson
Spearman
0.185226
0.188806
0.087062
0.071611
-0.12925
-0.16443
0.003346
-0.00577
0.066434
0.061261
0.588328
0.656374
0.329233
0.213334
0.977269
0.960797
Table Q27. Results for “increases /decreases” and L_80 minus L_50 for dBA.
Type Corr p value
Pearson
Spearman
-0.51396
-0.59534
0.192587
0.119450
Pearson
Spearman
Pearson
Spearman n/a n/a
-0.09045
0.11007 n/a n/a
0.758460
0.707967
Pearson
Spearman
Pearson
Spearman
Pearson
Spearman
Pearson
Spearman
-0.18729
-0.17186
-0.20949
-0.28347
-0.04449
-0.06967
0.054143
0.061433
0.471648
0.509531
0.362086
0.213047
0.769054
0.645469
0.594543
0.545803
Pearson
Spearman
Pearson
Spearman
Pearson
Spearman
0.128014
0.021257
0.246875
0.184888
0.022717
0
0.425084
0.895049
0.059430
0.160950
0.846604
1
NCEMBT-080201 359
6
6
5
5
3
4
4
Bldg ID
1
2
3
1
2
9
9
10
10
8
8
7
7
APPENDIX Q- SOUND LEVEL DATA
Table Q28. Results for “understandable” and L_90 minus L_50.
Type Corr
Pearson 0.159698
Spearman
Pearson
Spearman
Pearson
0.255146
-0.12982
0.104911 n/a
Spearman
Pearson
Spearman
Pearson
Spearman
Pearson
Spearman n/a
0.438376
0.366072
-0.20167
-0.28347 n/a n/a
Pearson
Spearman
Pearson
Spearman
Pearson
Spearman
Pearson
Spearman
-0.04382
0
0.020789
0.103575
-0.13517
0.048476
0.182197
0.173174 p value
0.705618
0.541958
0.781459
0.822876 n/a n/a
0.078382
0.148425
0.380692
0.213047 n/a n/a
0.666739
1
0.897347
0.519297
0.307393
0.715412
0.117702
0.137334
360 NCEMBT-080201
APPENDIX Q- SOUND LEVEL DATA
Q14.
S
TATISTICAL
R
ESULTS
I
N
C
OMPARISON
O
F
S
OUND
M
EASUREMENTS
W
ITH
A
NSWERS
T
O
T HE O CCUPANT P ERCEPTION Q UESTIONNAIRE F OR T HE Q UESTION “I H EAR S OUNDS F ROM
T ELEPHONE /S PEAKER P HONE C ONVERSATIONS T HAT C ARRY I NTO M Y W ORK A REA ”
(SndTelHear) with follow on questions concerning the sound affecting productivity (SndTelProdAffect), if the sound was annoying/distracting (SndTelAnnoy), and how soon the annoyance/distraction occurred
(SndTelDistrWithin) and for how long (SndTelDistrFor) the annoyance/distraction continued
(Type = statistical analysis performed; Corr = correlation, yellow highlight = significant [p<0.05]; green highlight = moderately significant [0.05<p<0.075]).
Table Q29. Statistical results in comparison of sound measurements with answers to the occupant perception questionnaire for the question “I hear sounds from telephone/speaker phone conversations that carry into my work area” for building 1
Variable
SndTelHear
SndTelHear
SndTelProdAffect
Type
Pearson
Spearman
Pearson
Corr
0.504866
0.28026
-0.04618 p value
0.201933
0.501380
0.913532
SndTelProdAffect
SndTelAnnoy
SndTelAnnoy
SndTelDistrWithin
SndTelDistrWithin
SndTelDistrFor
SndTelDistrFor
Spearman
Pearson
Spearman
Pearson
Spearman
Pearson
Spearman
0.269321
0.269851
0.594937
-0.13751
0.038837
0.117797
0.283069
0.518911
0.518056
0.119766
0.768763
0.934118
0.801406
0.538466
Table Q30. Statistical results in comparison of sound measurements with answers to the occupant perception questionnaire for the question “I hear sounds from telephone/speaker phone conversations that carry into my work area” for building 2.
Variable
SndTelHear
Type
Pearson
Corr
-0.11263 p value
0.810012
SndTelHear
SndTelProdAffect
Spearman
Pearson
0.130847
0.354265
0.779764
0.490833
SndTelProdAffect
SndTelAnnoy
SndTelAnnoy
SndTelDistrWithin
SndTelDistrWithin
SndTelDistrFor
SndTelDistrFor
Spearman
Pearson
Spearman
Pearson
Spearman
Pearson
Spearman
0.223906
0.518566
0.318182
-0.42187
-0.38889
-0.90999
-0.83333
0.669754
0.291875
0.538834
0.578133
0.611111
0.090014
0.166667
NCEMBT-080201 361
APPENDIX Q- SOUND LEVEL DATA
Table Q31. Statistical results in comparison of sound measurements with answers to the occupant perception questionnaire for the question “I hear sounds from telephone/speaker phone conversations that carry into my work area” for building 3.
Variable
SndTelHear
Type
Pearson
Corr
-0.33665 p value
0.239214
SndTelHear
SndTelProdAffect
SndTelProdAffect
SndTelAnnoy
Spearman
Pearson
Spearman
Pearson
-0.47739
-0.07000
0.292877
-0.32913
0.084299
0.837950
0.382102
0.322999
SndTelAnnoy
SndTelDistrWithin
SndTelDistrWithin
SndTelDistrFor
SndTelDistrFor
Spearman
Pearson
Spearman
Pearson
Spearman
0.142899
0.171002
0.287914
-0.06536
0.393422
0.675106
0.615160
0.390590
0.848573
0.231280
Table Q32. Statistical results in comparison of sound measurements with answers to the occupant perception questionnaire for the question “I hear sounds from telephone/speaker phone conversations that carry into my work area” for building 4.
Variable Type Corr p value
SndTelHear
SndTelHear
SndTelProdAffect
SndTelProdAffect
SndTelAnnoy
Pearson
Spearman
Pearson
Spearman
Pearson
-0.14054
-0.13493
-0.05024
-0.03924
0.105124
0.590564
0.605637
0.858869
0.889585
0.709255
SndTelAnnoy
SndTelDistrWithin
SndTelDistrWithin
SndTelDistrFor
SndTelDistrFor
Spearman
Pearson
Spearman
Pearson
Spearman
0.155894
0.144614
0.080294
0.059849
0.090763
0.579028
0.671395
0.814458
0.861241
0.790702
Table Q33. Statistical results in comparison of sound measurements with answers to the occupant perception questionnaire for the question “I hear sounds from telephone/speaker phone conversations that carry into my work area” for building 5.
Variable Type Corr p value
SndTelHear
SndTelHear
SndTelProdAffect
SndTelProdAffect
Pearson
Spearman
Pearson
Spearman
0.125565
0.147542
-0.24431
-0.31176
0.587590
0.523324
0.328557
0.207890
SndTelAnnoy
SndTelAnnoy
SndTelDistrWithin
SndTelDistrWithin
SndTelDistrFor
SndTelDistrFor
Pearson
Spearman
Pearson
Spearman
Pearson
Spearman
-0.00968
-0.05803
-0.16302
-0.24189
-0.43168
-0.53409
0.969579
0.819100
0.561574
0.385090
0.108112
0.040283
362 NCEMBT-080201
APPENDIX Q- SOUND LEVEL DATA
Table Q34. Statistical results in comparison of sound measurements with answers to the occupant perception questionnaire for the question “I hear sounds from telephone/speaker phone conversations that carry into my work area” for building 6.
Variable Type Corr p value
SndTelHear
SndTelHear
SndTelProdAffect
SndTelProdAffect
SndTelAnnoy
Pearson
Spearman
Pearson
Spearman
Pearson
0.142766
-0.05154
-0.27303
-0.30689
-0.18042
0.343893
0.733709
0.072946
0.042741
0.241200
SndTelAnnoy
SndTelDistrWithin
SndTelDistrWithin
SndTelDistrFor
SndTelDistrFor
Spearman
Pearson
Spearman
Pearson
Spearman
-0.29614
-0.00987
-0.04139
-0.17377
-0.27432
0.050960
0.951810
0.799820
0.283573
0.086719
Table Q35. Statistical results in comparison of sound measurements with answers to the occupant perception questionnaire for the question “I hear sounds from telephone/speaker phone conversations that carry into my work area” for building 7.
Variable Type Corr p value
SndTelHear
SndTelHear
SndTelProdAffect
SndTelProdAffect
Pearson
Spearman
Pearson
Spearman
0.009336
-0.06584
0.110619
0.106004
0.926928
0.517317
0.288508
0.309218
SndTelAnnoy
SndTelAnnoy
SndTelDistrWithin
SndTelDistrWithin
SndTelDistrFor
SndTelDistrFor
Pearson
Spearman
Pearson
Spearman
Pearson
Spearman
0.032546
0.012143
-0.16363
-0.21844
0.07414
-0.04161
0.755490
0.907529
0.141868
0.048659
0.507989
0.710504
Table Q36. Statistical results in comparison of sound measurements with answers to the occupant perception questionnaire for the question “I hear sounds from telephone/speaker phone conversations that carry into my work area” for building 8.
Variable Type Corr p value
SndTelHear
SndTelHear
SndTelProdAffect
SndTelProdAffect
Pearson
Spearman
Pearson
Spearman
-0.12239
-0.17783
0.065884
0.092829
0.445859
0.265995
0.686278
0.568871
SndTelAnnoy
SndTelAnnoy
SndTelDistrWithin
SndTelDistrWithin
SndTelDistrFor
SndTelDistrFor
Pearson
Spearman
Pearson
Spearman
Pearson
Spearman
0.092426
0.035771
0.290261
0.244447
0.214489
0.195136
0.570557
0.826545
0.095861
0.163534
0.223173
0.268752
NCEMBT-080201 363
APPENDIX Q- SOUND LEVEL DATA
Table Q37. Statistical results in comparison of sound measurements with answers to the occupant perception questionnaire for the question “I hear sounds from telephone/speaker phone conversations that carry into my work area” for building 9.
Variable
SndTelHear
Type
Pearson
Corr
0.23115 p value
0.078163
SndTelHear
SndTelProdAffect
SndTelProdAffect
SndTelAnnoy
Spearman
Pearson
Spearman
Pearson
0.274131
-0.02712
0.040738
0.092431
0.035639
0.841276
0.763511
0.494072
SndTelAnnoy
SndTelDistrWithin
SndTelDistrWithin
SndTelDistrFor
SndTelDistrFor
Spearman
Pearson
Spearman
Pearson
Spearman
0.182455
-0.14944
-0.02192
0.053858
0.079816
0.174331
0.295253
0.878663
0.707395
0.577690
Table Q38 Statistical results in comparison of sound measurements with answers to the occupant perception questionnaire for the question “I hear sounds from telephone/speaker phone conversations that carry into my work area” for building 10.
Variable Type Corr p value
SndTelHear
SndTelHear
SndTelProdAffect
SndTelProdAffect
SndTelAnnoy
Pearson
Spearman
Pearson
Spearman
Pearson
-0.00929
0.019067
-0.04518
-0.06842
0.007169
0.936947
0.871020
0.712423
0.576444
0.953377
SndTelAnnoy
SndTelDistrFor
SndTelDistrFor
SndTelDistrWithin
SndTelDistrWithin
Spearman
Pearson
Spearman
Pearson
Spearman
-0.03102
0.159326
0.102253
-0.02426
-0.02077
0.800245
0.212297
0.425192
0.850299
0.871645
364 NCEMBT-080201
APPENDIX Q- SOUND LEVEL DATA
Q15.
S
TATISTICAL
R
ESULTS
I
N
C
OMPARISON
O
F
S
OUND
M
EASUREMENTS
A
ND
T
HE
C
AUSE
O F T HE T ELEPHONE /S PEAKERPHONE D ISTRACTION
(Bldg ID = building identification; Type = statistical analysis performed; Corr = correlation, yellow highlight = significant [p<0.05]; green highlight = moderately significant [0.05<p<0.075]; n/a = not applicable as there were no responses to this question).
7
8
6
7
5
6
4
5
Bldg ID
1
1
2
3
4
2
3
8
9
9
10
10
Table Q39. Results for “too loud” and L_99 minus L_50 for dBA.
Type
Pearson
Spearman
Pearson
Corr
-0.16589
-0.12991
0.392977
Spearman
Pearson
Spearman
Pearson
Spearman
Pearson
Spearman
Pearson
0.487582
-0.03834
0.11007
0.000425
0
0.274622
0.314922
0.175178
Spearman
Pearson
Spearman
Pearson
Spearman
Pearson
Spearman
Pearson
Spearman
0.212295
-0.0387
-0.02009
0.143053
0.034335
-0.02796
0
-0.09472
-0.08672 p value
0.694610
0.759138
0.383159
0.267032
0.896478
0.707967
0.998708
1
0.228300
0.164388
0.244242
0.156649
0.703720
0.843498
0.372252
0.831239
0.833491
1
0.418889
0.459436
NCEMBT-080201 365
6
6
5
5
4
4
3
3
Bldg ID
2
2
1
1
9
9
10
8
8
7
7
APPENDIX Q- SOUND LEVEL DATA
Table Q40. Results for “intermittent/unpredictable” and L_95 minus L_50 for dBA.
Type Corr p value
Pearson
Spearman
Pearson
Spearman n/a n/a n/a n/a
Pearson
Spearman
Pearson
Spearman
-0.07218
0.207255
0.022541
0.104592 n/a n/a n/a n/a
0.806283
0.477113
0.931571
0.689528
10
Pearson
Spearman
Pearson
Spearman
Pearson
Spearman
Pearson
Spearman
Pearson
Spearman
Pearson
Spearman
0.167554
0.150812
0.013898
-0.04061
-0.04331
0.013872
-0.01043
0.016361
0.003222
-0.0168
-0.0388
-0.04149
0.467858
0.514054
0.926959
0.788736
0.670348
0.891601
0.948375
0.919133
0.980679
0.899501
0.741042
0.723780
366 NCEMBT-080201
APPENDIX Q- SOUND LEVEL DATA
7
7
6
6
5
5
4
4
Bldg ID
1
1
3
3
2
2
9
9
8
8
10
10
6
6
5
5
4
4
3
3
Bldg ID
2
2
1
1
9
9
10
10
8
8
7
7
Table Q41. Results for “increases /decreases” and L_80 minus L_50 for dBA.
Type Corr p value
Pearson
Spearman
Pearson
Spearman n/a n/a n/a n/a
Pearson
Spearman
Pearson
Spearman
-0.1499
-0.47697
-0.11536
-0.10459 n/a n/a n/a n/a
0.609013
0.084614
0.659303
0.689528
Pearson
Spearman
Pearson
Spearman
Pearson
Spearman
Pearson
Spearman
Pearson
Spearman
Pearson
Spearman
0.213112
0.188982
0.041985
-0.08594
0.094176
0.082213
-0.04749
-0.04467
0.07708
0.11408
0.075713
0.058219
0.353657
0.411972
0.781747
0.570093
0.353822
0.418523
0.768108
0.781537
0.561741
0.389608
0.518532
0.619795
Table Q42. Results for “understandable” and L_90 minus L_50 for dBA.
Type Corr
Pearson
Spearman
0.386271
0.232397
Pearson
Spearman
Pearson
Spearman
-0.60434
-0.81264
0.060453
-0.15776
Pearson
Spearman
Pearson
Spearman
Pearson
Spearman
Pearson
Spearman
0.21728
0.324067
-0.27345
-0.42021
-0.1564
-0.10272
-0.0298
-0.05484
Pearson
Spearman
Pearson
Spearman
Pearson
Spearman
-0.12862
-0.07862
0.103821
0.110256
0.116112
0.121339 p value
0.344560
0.579690
0.150628
0.026310
0.837344
0.590129
0.402196
0.204452
0.230367
0.057880
0.299298
0.496928
0.769672
0.589771
0.422862
0.625137
0.433908
0.405799
0.321183
0.299728
NCEMBT-080201 367
APPENDIX Q- SOUND LEVEL DATA
Q16.
S
TATISTICAL
R
ESULTS
I
N
C
OMPARISON
O
F
S
OUND
M
EASUREMENTS
A
ND
T
HE
Q UESTION “I H EAR S OUNDS F ROM C ONVERSATIONS T HAT C ARRY I NTO M Y W ORK A REA ”
… (SndConvHear) with follow on questions concerning the sound affecting productivity
(SndConvProdAffect), if the sound was annoying/distracting (SndConvAnnoy), and how soon the annoyance/distraction occurred (SndConvDistrWithin) and for how long (SndConvDistrFor) the annoyance/distraction continued
(Bldg ID = building identification; Type = statistical analysis performed; Corr = correlation, yellow highlight = significant [p<0.05]; green highlight = moderately significant [0.05<p<0.075]; n/a = not applicable as there were no responses to this question).
Table Q43. Statistical results in comparison of sound measurements and the question “i hear sounds from conversations that carry into my work area” for building 1.
Variable Type Corr p value
SndConvHear
SndConvHear
SndConvAnnoy
Pearson
Spearman
Pearson
0.528707
0.797468
0.511067
0.177920
0.017742
0.241103
SndConvAnnoy
SndConvProdAffect
SndConvProdAffect
SndConvDistrWithin
SndConvDistrWithin
SndConvDistrFor
SndConvDistrFor
Spearman
Pearson
Spearman
Pearson
Spearman
Pearson
Spearman
0.695522
-0.05403
0.258075
-0.30852
-0.43771
-0.20959
-0.18759
0.082711
0.908411
0.576321
0.551906
0.385361
0.690214
0.721913
Table Q44. Statistical results in comparison of sound measurements and the question “i hear sounds from conversations that carry into my work area” for building 2.
Variable Type Corr p value
SndConvHear
SndConvHear
SndConvAnnoy
Pearson
Spearman
Pearson
0.065534
0.112621
0.212581
0.888985
0.810019
0.647210
SndConvAnnoy
SndConvProdAffect
SndConvProdAffect
SndConvDistrWithin
SndConvDistrWithin
SndConvDistrFor
SndConvDistrFor
Spearman
Pearson
Spearman
Pearson
Spearman
Pearson
Spearman
-0.00943
0.067524
0
0.105384
0.25
-0.14612
-0.15811
0.983985
0.885629
1
0.866069
0.685038
0.814621
0.799525
368 NCEMBT-080201
APPENDIX Q- SOUND LEVEL DATA
Table Q45. Statistical results in comparison of sound measurements and the question “i hear sounds from conversations that carry into my work area” for building 3.
Variable Type Corr p value
SndConvHear
SndConvHear
SndConvAnnoy
SndConvAnnoy
SndConvProdAffect
Pearson
Spearman
Pearson
Spearman
Pearson
-0.73872
-0.42297
-0.17281
0.321052
-0.13454
0.002545
0.131851
0.572357
0.284810
0.661241
SndConvProdAffect
SndConvDistrWithin
SndConvDistrWithin
SndConvDistrFor
SndConvDistrFor
Spearman
Pearson
Spearman
Pearson
Spearman
0.228927
-0.21381
0.103679
-0.37508
0.278549
0.451861
0.483041
0.736069
0.206643
0.356761
Table Q46. Statistical results in comparison of sound measurements and the question “i hear sounds from conversations that carry into my work area” for building 4.
Variable Type Corr p value
SndConvHear
SndConvHear
SndConvAnnoy
SndConvAnnoy
Pearson
Spearman
Pearson
Spearman
-0.07881
-0.06263
0.078312
0.094747
0.763681
0.811270
0.781462
0.736965
SndConvProdAffect
SndConvProdAffect
SndConvDistrWithin
SndConvDistrWithin
SndConvDistrFor
SndConvDistrFor
Pearson
Spearman
Pearson
Spearman
Pearson
Spearman
0.150273
0.06055
0.20166
0.125251
0.574285
0.609904
0.592950
0.830266
0.508822
0.683487
0.040108
0.026873
Table Q47. Statistical results in comparison of sound measurements and the question “i hear sounds from conversations that carry into my work area” for building 5.
Variable
SndConvHear
Type
Pearson
Corr
0.360662 p value
0.108240
SndConvHear
SndConvAnnoy
SndConvAnnoy
Spearman
Pearson
Spearman
0.362826
0.162805
0.084865
0.105985
0.480744
0.714552
SndConvProdAffect
SndConvProdAffect
SndConvDistrWithin
SndConvDistrWithin
SndConvDistrFor
SndConvDistrFor
Pearson
Spearman
Pearson
Spearman
Pearson
Spearman
-0.01204
-0.15954
0.039099
-0.03659
-0.40555
-0.3759
0.958700
0.489694
0.881566
0.889116
0.106298
0.137011
NCEMBT-080201 369
APPENDIX Q- SOUND LEVEL DATA
Table Q48. Statistical results in comparison of sound measurements and the question “i hear sounds from conversations that carry into my work area” for building 6.
Variable
SndConvHear
Type
Pearson
Corr
0.186093 p value
0.215620
SndConvHear
SndConvAnnoy
SndConvAnnoy
SndConvProdAffect
Spearman
Pearson
Spearman
Pearson
0.005305
-0.11379
-0.24872
-0.1554
0.972087
0.451478
0.095559
0.302416
SndConvProdAffect
SndConvDistrWithin
SndConvDistrWithin
SndConvDistrFor
SndConvDistrFor
Spearman
Pearson
Spearman
Pearson
Spearman
-0.24088
-0.03794
-0.0524
-0.30492
-0.34426
0.106824
0.818635
0.751399
0.059091
0.031870
Table Q49. Statistical results in comparison of sound measurements and the question “i hear sounds from conversations that carry into my work area” for building 7.
Variable Type Corr p value
SndConvHear
SndConvHear
SndConvAnnoy
SndConvAnnoy
SndConvProdAffect
Pearson
Spearman
Pearson
Spearman
Pearson
0.044515
-0.03553
0.090461
0.052212
0.140882
0.661743
0.726973
0.378209
0.611514
0.168695
SndConvProdAffect
SndConvDistrWithin
SndConvDistrWithin
SndConvDistrFor
SndConvDistrFor
Spearman
Pearson
Spearman
Pearson
Spearman
0.149952
-0.11809
0.011238
0.106259
0.055050
0.142644
0.303142
0.922208
0.354485
0.632150
Table Q50. Statistical results in comparison of sound measurements and the question “i hear sounds from conversations that carry into my work area” for building 8.
Variable Type Corr p value
SndConvHear
SndConvHear
SndConvAnnoy
SndConvAnnoy
Pearson
Spearman
Pearson
Spearman
0.015406
0.032749
0.03781
0.091192
0.923839
0.838929
0.814440
0.570688
SndConvProdAffect
SndConvProdAffect
SndConvDistrWithin
SndConvDistrWithin
SndConvDistrFor
SndConvDistrFor
Pearson
Spearman
Pearson
Spearman
Pearson
Spearman
-0.0034
0.067967
0.187482
0.198669
0.132086
0.09315
0.983186
0.672858
0.304181
0.275695
0.471139
0.612001
370 NCEMBT-080201
APPENDIX Q- SOUND LEVEL DATA
Table Q51. Statistical results in comparison of sound measurements and the question “i hear sounds from conversations that carry into my work area” for building 9.
Variable Type Corr p value
SndConvHear
SndConvHear
SndConvAnnoy
SndConvAnnoy
SndConvProdAffect
Pearson
Spearman
Pearson
Spearman
Pearson
0.391823
0.451778
0.124438
0.172839
0.027626
0.002148
0.000328
0.352014
0.194481
0.836909
SndConvProdAffect
SndConvDistrWithin
SndConvDistrWithin
SndConvDistrFor
SndConvDistrFor
Spearman
Pearson
Spearman
Pearson
Spearman
0.028961
-0.19011
-0.09836
0.089918
0.147478
0.829139
0.190741
0.501335
0.538936
0.311902
Table Q52. Statistical results in comparison of sound measurements and the question “i hear sounds from conversations that carry into my work area” for building 10.
Variable Type Corr p value
SndConvHear
SndConvHear
SndConvAnnoy
SndConvAnnoy
Pearson
Spearman
Pearson
Spearman
0.037604
0.005957
0.051526
0.031714
0.748738
0.959546
0.660640
0.787076
SndConvProdAffect
SndConvProdAffect
SndConvDistrWithin
SndConvDistrWithin
SndConvDistrFor
SndConvDistrFor
Pearson
Spearman
Pearson
Spearman
Pearson
Spearman
-0.01275
0.009255
-0.05864
-0.06170
0.019782
0.033577
0.913572
0.937184
0.637360
0.619906
0.873754
0.787356
NCEMBT-080201 371
APPENDIX Q- SOUND LEVEL DATA
Q17.
S
TATISTICAL
R
ESULTS
I
N
C
OMPARISON
O
F
S
OUND
M
EASUREMENTS
A
ND
T
HE
C
AUSE
O F C ONVERSATION D ISTRACTION
(Bldg ID = building identification; Type = statistical analysis performed; Corr = correlation, yellow highlight = significant [p<0.05]; green highlight = moderately significant [0.05<p<0.075]; n/a = not applicable as there were no responses to this question).
7
8
5
7
5
5
4
5
Bldg ID
1
1
2
3
4
2
3
8
9
9
10
10
Table Q53. Results for “too loud” and L_99 minus L_50 for SIL.
Type
Pearson
Spearman
Pearson
Corr
-0.03677
0.389742
0.392977
Spearman
Pearson
Spearman
Pearson
Spearman
Pearson
Spearman
Pearson
0.487582
-0.10853
0.092113
0.338169
0.270056
0.228588
0.386795
0.000354
Spearman
Pearson
Spearman
Pearson
Spearman
Pearson
Spearman
Pearson
Spearman
-0.00342
-0.04809
-0.07968
-0.04887
-0.02573
-0.08312
-0.07501
-0.09829
-0.07247
P value
0.931127
0.339863
0.383159
0.267032
0.711905
0.754137
0.184304
0.294503
0.318931
0.083249
0.998138
0.981982
0.636416
0.433054
0.761557
0.873114
0.531378
0.572308
0.401472
0.536635
372 NCEMBT-080201
APPENDIX Q- SOUND LEVEL DATA
7
8
6
7
5
6
4
5
Bldg ID
1
1
2
3
4
2
3
8
9
9
10
10
7
7
6
6
5
5
4
4
Bldg ID
1
1
3
3
2
2
9
9
8
8
10
10
Table Q54. Results for “intermittent/unpredictable” and L_95 minus L_50 for SIL
Type
Pearson
Spearman
Corr n/a n/a p value
Pearson
Spearman
Pearson
Spearman n/a n/a
-0.03834
0.11007
Pearson
Spearman
Pearson
Spearman
Pearson
Spearman
Pearson
Spearman
Pearson
Spearman
Pearson
Spearman
Pearson
Spearman
-0.22163
-0.17753 n/a n/a
-0.07397
-0.12292
0.076736
0.110845
-0.02395
0.028718
0.062121
0.048476
-0.04325
-0.05469 n/a n/a n/a n/a
0.896478
0.707967
0.392611
0.495454 n/a n/a
0.625182
0.415750
0.450293
0.274719
0.881852
0.858539
0.640209
0.715412
0.712555
0.641183
Table Q55. Results for “increases /decreases” and L_95 minus L_50 for SIL.
Type
Pearson
Spearman
Pearson
Corr n/a n/a
0.566149 p value n/a n/a
0.185189
Spearman
Pearson
Spearman
Pearson
Spearman
Pearson
Spearman
Pearson
0.524554
-0.08660
0.146760 n/a n/a
-0.07466
0.056695 n/a
0.226767
0.768474
0.616615 n/a n/a
0.747729
0.807158 n/a
Spearman
Pearson
Spearman
Pearson
Spearman
Pearson
Spearman
Pearson
Spearman n/a
-0.02512
0.095572
-0.06291
-0.10674
-0.07319
-0.03005
0.013945
-0.00479 n/a
0.805044
0.346699
0.695959
0.506532
0.581701
0.821268
0.905481
0.967491
NCEMBT-080201 373
6
6
5
5
3
4
4
Bldg ID
1
2
3
1
2
9
9
10
10
8
8
7
7
APPENDIX Q- SOUND LEVEL DATA
Table Q56. Results for “understandable” and L_95 minus L_50 for SIL.
Type Corr
Pearson 0.379225
Spearman
Pearson
Spearman
Pearson
0.168763
-0.60434
-0.81264
0
Spearman
Pearson
Spearman
Pearson
Spearman
Pearson
Spearman
0.037796
-0.41578
-0.40508
-0.04717
-0.21733
-0.14229
-0.24097
Pearson
Spearman
Pearson
Spearman
Pearson
Spearman
Pearson
Spearman
-0.00327
-0.00417
-0.02082
-0.04492
0.085347
0.134542
0.121672
0.110687 p value
0.354183
0.689526
0.150628
0.026310
1
0.897927
0.096936
0.106741
0.839102
0.343984
0.345511
0.106694
0.974399
0.967321
0.897194
0.780323
0.520410
0.309653
0.298396
0.344460
374 NCEMBT-080201
APPENDIX Q- SOUND LEVEL DATA
Q18.
S
TATISTICAL
R
ESULTS
I
N
C
OMPARISON
O
F
S
OUND
M
EASUREMENTS
A
ND
T
HE
Q UESTION “I H EAR S OUNDS F ROM P IPED I N M USIC O R M ASKING S OUNDS I N M Y W ORK
A REA ”
… (SndTelHear) with follow on questions concerning the sound affecting productivity
(SndMusProdAffect), if the sound was annoying/distracting (SndMusAnnoy), and how soon the annoyance/distraction occurred (SndMusDistrWithin) and for how long (SndMusDistrFor) the annoyance/distraction continued
(Bldg ID = building identification; Type = statistical analysis performed; Corr = correlation, yellow highlight = significant [p<0.05]; green highlight = moderately significant [0.05<p<0.075]; n/a = not applicable as there were no responses to this question; nd = not done).
Table Q57. Statistical Results In Comparison Of Sound Measurements And The Question “I Hear Sounds From Piped In Music Or
Masking Sounds In My Work Area” For Building 1.
Variable
SndMusHear
SndMusHear
SndMusAnnoy
Type
Pearson
Spearman
Pearson
Corr
0
0
1 p value
1
1
SndMusAnnoy
SndMusDistrWithin
SndMusDistrWithin
SndMusDistrFor
SndMusDistrFor
SndMusProdAffect
SndMusProdAffect
Spearman
Pearson
Spearman
Pearson
Spearman
Pearson
Spearman
1 n/a n/a n/a n/a
Nd
Nd n/a n/a n/a n/a nd nd
Table Q58. Statistical Results In Comparison Of Sound Measurements And The Question “I Hear Sounds From Piped In Music Or
Masking Sounds In My Work Area” for Building 2.
Variable
SndMusHear
SndMusHear
SndMusAnnoy
Type
Pearson
Spearman
Pearson
Corr n/a n/a n/a p value n/a n/a n/a
SndMusAnnoy
SndMusDistrWithin
SndMusDistrWithin
SndMusDistrFor
SndMusDistrFor
SndMusProdAffect
SndMusProdAffect
Spearman
Pearson
Spearman
Pearson
Spearman
Pearson
Spearman n/a n/a n/a n/a n/a
Nd
Nd n/a n/a n/a n/a n/a nd nd
NCEMBT-080201 375
APPENDIX Q- SOUND LEVEL DATA
Table Q59. Statistical Results In Comparison Of Sound Measurements And The Question “I Hear Sounds From Piped In Music Or
Masking Sounds In My Work Area”for Building 3.
Variable Type Corr p value
SndMusHear
SndMusHear
SndMusAnnoy
SndMusAnnoy
SndMusDistrWithin
Pearson
Spearman
Pearson
Spearman
Pearson
-0.0456
0.329412 n/a n/a n/a
0.876975
0.250104 n/a n/a n/a
SndMusDistrWithin
SndMusDistrFor
SndMusDistrFor
SndMusProdAffect
SndMusProdAffect
Spearman
Pearson
Spearman
Pearson
Spearman n/a n/a n/a nd nd n/a n/a n/a nd nd
Table Q60. Statistical Results In Comparison Of Sound Measurements And The Question “I Hear Sounds From Piped In Music Or
Masking Sounds In My Work Area”for Building 4.
Variable Type Corr p value
SndMusHear
SndMusHear
SndMusAnnoy
SndMusAnnoy
Pearson
Spearman
Pearson
Spearman
0.002593
0.056814
-0.12249
-0.18759
0.992120
0.828534
0.817184
0.721913
SndMusDistrWithin
SndMusDistrWithin
SndMusDistrFor
SndMusDistrFor
SndMusProdAffect
SndMusProdAffect
Pearson
Spearman
Pearson
Spearman
Pearson
Spearman
-0.88081
-0.86603
-0.88081
-0.86603
Nd
Nd
0.313994
0.333333
0.313994
0.333333 nd nd
Table Q61. Statistical Results In Comparison Of Sound Measurements And The Question “I Hear Sounds From Piped In Music Or
Masking Sounds In My Work Area”for Building 5.
Variable Type Corr p value
SndMusHear
SndMusHear
SndMusAnnoy
SndMusAnnoy
Pearson
Spearman
Pearson
Spearman n/a n/a n/a n/a n/a n/a n/a n/a
SndMusDistrWithin
SndMusDistrWithin
SndMusDistrFor
SndMusDistrFor
SndMusProdAffect
SndMusProdAffect
Pearson
Spearman
Pearson
Spearman
Pearson
Spearman n/a n/a n/a n/a nd nd n/a n/a n/a n/a nd nd
376 NCEMBT-080201
APPENDIX Q- SOUND LEVEL DATA
Table Q62. Statistical Results In Comparison Of Sound Measurements And The Question “I Hear Sounds From Piped In Music Or
Masking Sounds In My Work Area”for Building 6.
Variable
SndMusHear
Type
Pears
Corr
-0.20152 p value
0.179281
SndMusHear
SndMusAnnoy
SndMusAnnoy
SndMusDistrWithin
Spear
Pears
Spear
Pears
-0.12022
0.330349
0.347612
-0.12770
0.426121
0.123672
0.104105
0.663522
SndMusDistrWithin
SndMusDistrFor
SndMusDistrFor
SndMusProdAffect
SndMusProdAffect
Spear
Pears
Spear
Pearson
Spearman
-0.28369
0.304638
0.221578 nd nd
0.325650
0.289592
0.446470 nd nd
Table Q63. Statistical Results In Comparison Of Sound Measurements And The Question “I Hear Sounds From Piped In Music Or
Masking Sounds In My Work Area”for Building 7.
Variable Type Corr p value
SndMusHear
SndMusHear
SndMusAnnoy
SndMusAnnoy
SndMusDistrWithin
Pears
Spear
Pears
Spear
Pears
-0.00895
0.036246
-0.04915
-0.07916
-0.35433
0.929968
0.721708
0.807666
0.694700
0.178136
SndMusDistrWithin
SndMusDistrFor
SndMusDistrFor
SndMusProdAffect
SndMusProdAffect
Spear
Pears
Spear
Pearson
Spearman
-0.33488
-0.07315
-0.02356 nd nd
0.204843
0.787744
0.930974 nd nd
Table Q64. Statistical Results In Comparison Of Sound Measurements And The Question “I Hear Sounds From Piped In Music Or
Masking Sounds In My Work Area”for Building 8.
Variable Type Corr p value
SndMusHear
SndMusHear
SndMusAnnoy
SndMusAnnoy
Pears
Spear
Pears
Spear
-0.26169
0.046734
-0.50385
-0.38464
0.098385
0.771702
0.248942
0.394229
SndMusDistrWithin
SndMusDistrWithin
SndMusDistrFor
SndMusDistrFor
SndMusProdAffect
SndMusProdAffect
Pears
Spear
Pears
Spear
Pearson
Spearman
-0.23533
0.098374
-0.67438
-0.76667 nd nd
0.653525
0.852915
0.141783
0.075315 nd nd
NCEMBT-080201 377
APPENDIX Q- SOUND LEVEL DATA
Table Q65. Statistical Results In Comparison Of Sound Measurements And The Question “I Hear Sounds From Piped In Music Or
Masking Sounds In My Work Area”for Building 9.
Variable Type Corr p value
SndMusHear
SndMusHear
SndMusAnnoy
SndMusAnnoy
SndMusDistrWithin
Pears
Spear
Pears
Spear
Pears
0.011108
-0.08568
0.365502
0.274030
0.048341
0.933453
0.518756
0.015945
0.075372
0.826622
SndMusDistrWithin
SndMusDistrFor
SndMusDistrFor
SndMusProdAffect
SndMusProdAffect
Spear
Pears
Spear
Pearson
Spearman
0.150775
0.186063
-0.00295 nd nd
0.492267
0.395312
0.989358 nd nd
Table Q66. Statistical Results In Comparison Of Sound Measurements And The Question “I Hear Sounds From Piped In Music Or
Masking Sounds In My Work Area”of Building 10.
Variable Type Corr p value
SndMusHear
SndMusHear
SndMusAnnoy
SndMusAnnoy
Pears
Spear
Pears
Spear
-0.04476
-0.10085
-0.09413
-0.2514
0.702948
0.389269
0.771059
0.430578
SndMusDistrWithin
SndMusDistrWithin
SndMusDistrFor
SndMusDistrFor
SndMusProdAffect
SndMusProdAffect
Pears
Spear
Pears
Spear
Pearson
Spearman
-0.07266
0.123349
0.266205
0.203548 nd nd
0.852634
0.751879
0.488704
0.599387 nd nd
378 NCEMBT-080201
APPENDIX Q- SOUND LEVEL DATA
Q19.
S
TATISTICAL
R
ESULTS
I
N
C
OMPARISON
O
F
S
OUND
M
EASUREMENTS
A
ND
T
HE
C
AUSE
O F T HE P IPED I N M USIC O R M ASKING S OUND D ISTRACTION
(Bldg ID = building identification; Type = statistical analysis performed; Corr = correlation, yellow highlight = significant [p<0.05]; green highlight = moderately significant [0.05<p<0.075]; n/a = not applicable as there were no responses to this question).
7
8
6
7
5
6
4
5
Bldg ID
1
1
2
3
4
2
3
8
9
9
10
10
Table Q67. Results for “too loud” and L_80 minus L_10 for dBA.
Type
Pearson
Spearman
Pearson
Corr
0.20589
0.425243 n/a
Spearman
Pearson
Spearman
Pearson
Spearman
Pearson
Spearman
Pearson n/a
-0.14297
-0.21138 n/a n/a n/a n/a
-0.11451
Spearman
Pearson
Spearman
Pearson
Spearman
Pearson
Spearman
Pearson
Spearman
-0.07248
0.059203
0.055082
-0.25326
-0.27691
-0.18299
-0.16802
-0.26330
-0.29637 p value
0.624727
0.293576 n/a n/a
0.625850
0.468190 n/a n/a n/a n/a
0.448592
0.632161
0.560506
0.588154
0.110113
0.079655
0.165362
0.203363
0.022468
0.009828
NCEMBT-080201 379
6
6
5
5
4
4
3
3
Bldg ID
2
2
1
1
9
9
10
10
8
8
7
7
APPENDIX Q- SOUND LEVEL DATA
Table Q68. Results for “intermittent/unpredictable” and L_80 minus L_50 for dBA.
Type Corr p value
Pearson
Spearman
Pearson
Spearman n/a n/a n/a n/a
Pearson
Spearman
Pearson
Spearman n/a n/a
-0.18729
-0.17186 n/a n/a n/a n/a n/a n/a
0.471648
0.509531
Pearson
Spearman
Pearson
Spearman
Pearson
Spearman
Pearson
Spearman
Pearson
Spearman
Pearson
Spearman n/a n/a
0.241657
0.257399
0.035503
-0.02795
0.250788
0.191316
-0.08242
0.060096
0.212712
0.186671 n/a n/a
0.105669
0.084176
0.727185
0.783591
0.113750
0.230823
0.534854
0.651171
0.066917
0.108804
380 NCEMBT-080201
APPENDIX Q- SOUND LEVEL DATA
7
7
6
6
5
5
4
4
Bldg ID
1
1
3
3
2
2
9
9
8
8
10
10
6
6
5
5
4
4
3
3
Bldg ID
2
2
1
1
9
9
10
10
8
8
7
7
Table Q69. Results for “increases /decreases” and L_80 minus L_50 for dBA.
Type Corr p value
Pearson
Spearman
Pearson
Spearman n/a n/a n/a n/a
Pearson
Spearman
Pearson
Spearman
-0.14321
-0.29352 n/a n/a n/a n/a n/a n/a
0.625257
0.308431 n/a n/a
Pearson
Spearman
Pearson
Spearman
Pearson
Spearman
Pearson
Spearman
Pearson
Spearman
Pearson
Spearman n/a n/a
-0.06363
-0.09964 n/a n/a n/a n/a
-0.13003
-0.12907
0.084206
0.09813 n/a n/a
0.674382
0.510008 n/a n/a n/a n/a
0.326322
0.329914
0.472588
0.402264
Table Q70. Results for “understandable” and L_80 minus L_50 for dBA.
Type Corr
Pearson
Spearman n/a n/a
Pearson
Spearman
Pearson
Spearman n/a n/a n/a n/a
Pearson
Spearman
Pearson
Spearman
Pearson
Spearman
Pearson
Spearman n/a n/a n/a n/a n/a n/a
-0.08346
-0.11337
Pearson
Spearman
Pearson
Spearman
Pearson
Spearman n/a n/a
0.042014
0.11408 n/a n/a p value n/a n/a n/a n/a n/a n/a
0.411485
0.263846 n/a n/a n/a n/a n/a n/a n/a n/a
0.752041
0.389608 n/a n/a
NCEMBT-080201 381
APPENDIX Q- SOUND LEVEL DATA
Q20.
S
TATISTICAL
R
ESULTS
I
N
C
OMPARISON
O
F
S
OUND
M
EASUREMENTS
A
ND
T
HE
Q UESTION “I H EAR S OUNDS F ROM O FFICE E QUIPMENT I N M Y W ORK A REA ”
… (SndEquipHear) with follow on questions concerning the sound affecting productivity
(SndEquipProdAffect), if the sound was annoying/distracting (SndEquipAnnoy), and how soon the annoyance/distraction occurred (SndEquipDistrWithin) and for how long (SndEquipDistrFor) the annoyance/distraction continued
(Bldg ID = building identification; Type = statistical analysis performed; Corr = correlation, yellow highlight = significant [p<0.05]; green highlight = moderately significant [0.05<p<0.075]; n/a = not applicable as there were no responses to this question).
Table Q71. Statistical Results In Comparison Of Sound Measurements And The Question “I Hear Sounds From Office Equipment
In My Work Area” for Building 1.
Variable Type Corr p value
SndEquipHear
SndEquipHear
SndEquipAnnoy
Pearson
Spearman
Pearson
0.697724
0.718185
0.564618
0.054341
0.044794
0.243072
SndEquipAnnoy
SndEquipProdAffect
SndEquipProdAffect
SndEquipDistrWithi
SndEquipDistrWithi
SndEquipDistrFor
SndEquipDistrFor
Spearman
Pearson
Spearman
Pearson
Spearman
Pearson
Spearman
0.338823
0.660195
0.562775
0.504524
0.516185
0.303130
0.176777
0.511215
0.153583
0.244957
0.386021
0.373253
0.620038
0.776099
Table Q72. Statistical Results In Comparison Of Sound Measurements And The Question “I Hear Sounds From Office Equipment
In My Work Area” for Building 2.
Variable Type Corr p value
SndEquipHear
SndEquipHear
SndEquipAnnoy
Pearson
Spearman
Pearson
0.063329
0.047170
0.808056
0.892705
0.920011
0.097989
SndEquipAnnoy
SndEquipProdAffect
SndEquipProdAffect
SndEquipDistrWithi
SndEquipDistrWithi
SndEquipDistrFor
SndEquipDistrFor
Spearman
Pearson
Spearman
Pearson
Spearman
Pearson
Spearman
0.789474
0.640070
0.459627
-0.20217
0.055556
-0.52476
-0.50000
0.112222
0.244736
0.436097
0.797828
0.944444
0.475244
0.500000
382 NCEMBT-080201
APPENDIX Q- SOUND LEVEL DATA
Table Q73. Statistical Results In Comparison Of Sound Measurements And The Question “I Hear Sounds From Office Equipment
In My Work Area” for Building 3.
Variable
SndEquipHear
Type
Pearson
Corr
0.204327 p value
0.483496
SndEquipHear
SndEquipAnnoy
SndEquipAnnoy
SndEquipProdAffect
Spearman
Pearson
Spearman
Pearson
0.390439
0.224054
0.328165
0.224054
0.167521
0.629109
0.472397
0.629109
SndEquipProdAffect
SndEquipDistrWithi
SndEquipDistrWithi
SndEquipDistrFor
SndEquipDistrFor
Spearman
Pearson
Spearman
Pearson
Spearman
0.328165
1
1
1
1
0.472397
Table Q74. Statistical Results In Comparison Of Sound Measurements And The Question “I Hear Sounds From Office Equipment
In My Work Area” for Building 4.
Variable Type Corr p value
SndEquipHear
SndEquipHear
SndEquipAnnoy
SndEquipAnnoy
SndEquipProdAffect
Pearson
Spearman
Pearson
Spearman
Pearson
-0.31413
-0.41625
0.253617
0.435692
0.233583
0.219482
0.096523
0.451749
0.180413
0.489398
SndEquipProdAffect
SndEquipDistrWithi
SndEquipDistrWithi
SndEquipDistrFor
SndEquipDistrFor
Spearman
Pearson
Spearman
Pearson
Spearman
0.381025
0.019229
-0.19627
0.387455
0.257248
0.247625
0.967361
0.673182
0.390476
0.577588
Table Q75. Statistical Results In Comparison Of Sound Measurements And The Question “I Hear Sounds From Office Equipment
In My Work Area” for Building 5.
Variable Type Corr p value
SndEquipHear
SndEquipHear
SndEquipAnnoy
SndEquipAnnoy
Pearson
Spearman
Pearson
Spearman
-0.2985
-0.2718
-0.1179
-0.2191
0.188643
0.233271
0.701156
0.471972
SndEquipProdAffect
SndEquipProdAffect
SndEquipDistrWithi
SndEquipDistrWithi
SndEquipDistrFor
SndEquipDistrFor
Pearson
Spearman
Pearson
Spearman
Pearson
Spearman
-0.0385
-0.2263
-0.0743
-0.2504
-0.3408
-0.5114
0.900439
0.457167
0.874064
0.58797
0.454397
0.240726
NCEMBT-080201 383
APPENDIX Q- SOUND LEVEL DATA
Table Q76. Statistical Results In Comparison Of Sound Measurements And The Question “I Hear Sounds From Office Equipment
In My Work Area” for Building 6.
Variable Type Corr p value
SndEquipHear
SndEquipHear
SndEquipAnnoy
SndEquipAnnoy
SndEquipProdAffect
Pearson
Spearman
Pearson
Spearman
Pearson
0.223015
0.191777
0.08895
0.033772
0.056824
0.136286
0.201677
0.672425
0.872674
0.787321
SndEquipProdAffect
SndEquipDistrWithi
SndEquipDistrWithi
SndEquipDistrFor
SndEquipDistrFor
Spearman
Pearson
Spearman
Pearson
Spearman
0.036457
-0.20984
-0.03451
-0.09544
-0.09737
0.862644
0.491399
0.910874
0.756444
0.751654
Table Q77. Statistical Results In Comparison Of Sound Measurements And The Question “I Hear Sounds From Office Equipment
In My Work Area” for Building 7.
Variable Type Corr p value
SndEquipHear
SndEquipHear
SndEquipAnnoy
SndEquipAnnoy
Pearson
Spearman
Pearson
Spearman
-0.04650
-0.10667
0.063454
-0.00840
0.647624
0.293318
0.576040
0.941081
SndEquipProdAffect
SndEquipProdAffect
SndEquipDistrWithi
SndEquipDistrWithi
SndEquipDistrFor
SndEquipDistrFor
Pearson
Spearman
Pearson
Spearman
Pearson
Spearman
0.163912
0.103795
0.002998
0.154672
0.210824
0.137020
0.146265
0.359542
0.985748
0.353819
0.203897
0.412039
Table Q78. Statistical Results In Comparison Of Sound Measurements And The Question “I Hear Sounds From Office Equipment
In My Work Area” for Building 8.
Variable Type Corr p value
SndEquipHear
SndEquipHear
SndEquipAnnoy
SndEquipAnnoy
Pearson
Spearman
Pearson
Spearman
0.063316
0.064022
-0.10959
-0.16401
0.694115
0.690874
0.518485
0.332070
SndEquipProdAffect
SndEquipProdAffect
SndEquipDistrWithi
SndEquipDistrWithi
SndEquipDistrFor
SndEquipDistrFor
Pearson
Spearman
Pearson
Spearman
Pearson
Spearman
-0.15766
-0.15302
0.050126
0.147844
0.277662
0.288675
0.351367
0.365895
0.883637
0.664423
0.408421
0.389283
384 NCEMBT-080201
APPENDIX Q- SOUND LEVEL DATA
Table Q79. Statistical Results In Comparison Of Sound Measurements And The Question “I Hear Sounds From Office Equipment
In My Work Area” for Building 9.
Variable
SndEquipHear
Type
Pearson
Corr
0.158144 p value
0.231587
SndEquipHear
SndEquipAnnoy
SndEquipAnnoy
SndEquipProdAffect
Spearman
Pearson
Spearman
Pearson
0.07119
-0.25183
-0.21133
-0.08625
0.592094
0.224601
0.310546
0.681843
SndEquipProdAffect
SndEquipDistrWithi
SndEquipDistrWithi
SndEquipDistrFor
SndEquipDistrFor
Spearman
Pearson
Spearman
Pearson
Spearman
0.033996
0.236395
0.137079
0.1048
0.136522
0.87184
0.378066
0.61269
0.699303
0.614148
Table Q80. Statistical Results In Comparison Of Sound Measurements And The Question “I Hear Sounds From Office Equipment
In My Work Area” for Building 10.
Variable Type Corr p value
SndEquipHear
SndEquipHear
SndEquipAnnoy
SndEquipAnnoy
SndEquipProdAffect
Pearson
Spearman
Pearson
Spearman
Pearson
0.382131
0.417021
-0.04031
-0.18475
-0.01994
0.000717
0.000198
0.802425
0.247535
0.901508
SndEquipProdAffect
SndEquipDistrWithi
SndEquipDistrWithi
SndEquipDistrFor
SndEquipDistrFor
Spearman
Pearson
Spearman
Pearson
Spearman
-0.07838
-0.13195
-0.11602
0.085692
0.096381
0.626183
0.601729
0.646637
0.735302
0.703619
NCEMBT-080201 385
APPENDIX Q- SOUND LEVEL DATA
Q21.
S
TATISTICAL
R
ESULTS
I
N
C
OMPARISON
O
F
S
OUND
M
EASUREMENTS
A
ND
T
HE
C
AUSE
O F T HE O FFICE E QUIPMENT S OUND D ISTRACTION
(Bldg ID = building identification; Type = statistical analysis performed; Corr = correlation, yellow highlight = significant [p<0.05]; green highlight = moderately significant [0.05<p<0.075]; n/a = not applicable as there were no responses to this question).
Table Q81. Statistical results in comparison of sound measurements and the cause of the office equipment sound distraction for
“too loud” and L_90 minus L_10 for NC.
Bldg ID
1
1
2
Type
Pearson
Spearman
Pearson
Corr
0.711935
0.755291
0.107818
P value
0.047593
0.030204
0.818024
5
6
4
5
3
4
2
3
Spearman
Pearson
Spearman
Pearson
Spearman
Pearson
Spearman
Pearson
0.104911
0.146143
0.18345
0.166617
0.080695
0.119589
0.092009
-0.27592
0.822876
0.618112
0.530152
0.522729
0.758180
0.605625
0.691617
0.063444
8
9
9
10
7
8
6
7
10
Spearman
Pearson
Spearman
Pearson
Spearman
Pearson
Spearman
Pearson
Spearman
-0.33963
0.048776
-0.03688
0.154862
0.153693
-0.17748
-0.12091
0.074811
0.148885
0.020933
0.631630
0.717077
0.333651
0.337359
0.178687
0.361656
0.523540
0.202363
386 NCEMBT-080201
APPENDIX Q- SOUND LEVEL DATA
Table Q82. Statistical results in comparison of sound measurements and the cause of the office equipment sound distraction for
“intermittent/unpredictable” and L_90 minus L_50 for NC.
Bldg ID Type Corr p value
2
2
1
1
3
Pearson
Spearman
Pearson
Spearman
Pearson
0.413375
0.433555
0.946149
0.812636 n/a
0.308691
0.283209
0.001255
0.026310 n/a
6
6
5
5
3
4
4
Spearman
Pearson
Spearman
Pearson
Spearman
Pearson
Spearman n/a
-0.03507
0.152767
0.101180
0.013710
0.329355
0.327780 n/a
0.893700
0.558313
0.662548
0.952965
0.025412
0.026164
9
9
10
10
8
8
7
7
Pearson
Spearman
Pearson
Spearman
Pearson
Spearman
Pearson
Spearman
0.068126
0.091684
-0.15912
-0.16872
-0.04420
-0.10392
0.046692
0.054693
0.502849
0.366758
0.320358
0.291658
0.739605
0.433449
0.690788
0.641183
Table Q83. Statistical results in comparison of sound measurements and the cause of the office equipment sound distraction for
“increases /decreases” and L_80 minus L_50 for NC.
Bldg ID
1
1
Type
Pearson
Spearman
Corr n/a n/a p value n/a n/a
3
3
2
2
Pearson
Spearman
Pearson
Spearman n/a n/a n/a n/a n/a n/a n/a n/a
7
7
6
6
5
5
4
4
Pearson
Spearman
Pearson
Spearman
Pearson
Spearman
Pearson
Spearman n/a n/a n/a n/a
0.218444
0.229186
0.027566
0.095572 n/a n/a n/a n/a
0.144713
0.125496
0.786509
0.346699
9
9
8
8
10
10
Pearson
Spearman
Pearson
Spearman
Pearson
Spearman
-0.16055
-0.15191
0.059652
0.068674 n/a n/a
0.315981
0.343061
0.653583
0.605283 n/a n/a
NCEMBT-080201 387
APPENDIX Q- SOUND LEVEL DATA
Table Q84. Statistical results in comparison of sound measurements and the cause of the office equipment sound distraction for
“understandable” and L_80 minus L_50 for NC.
Bldg ID Type Corr p value
2
2
1
1
3
Pearson
Spearman
Pearson
Spearman
Pearson n/a n/a
-0.58278
-0.52455 n/a n/a n/a
0.169709
0.226767 n/a
6
6
5
5
3
4
4
Spearman
Pearson
Spearman
Pearson
Spearman
Pearson
Spearman n/a
-0.33020
-0.33992
-0.12972
-0.09449
-0.08733
-0.06876 n/a
0.195516
0.181891
0.575181
0.683706
0.563866
0.649809
9
9
10
10
8
8
7
7
Pearson
Spearman
Pearson
Spearman
Pearson
Spearman
Pearson
Spearman
0.108630
0.106225 n/a n/a n/a n/a n/a n/a
0.284486
0.295347 n/a n/a n/a n/a n/a n/a
388 NCEMBT-080201
APPENDIX Q- SOUND LEVEL DATA
Q22.
S
TATISTICAL
R
ESULTS
I
N
C
OMPARISON
O
F
S
OUND
M
EASUREMENTS
A
ND
T
HE
Q UESTION “I H EAR S OUNDS F ROM B UILDING M ECHANICAL E QUIPMENT I N M Y W ORK A REA ”
… (SndMechHear) with follow on questions concerning the sound affecting productivity
(SndMechProdAffect), if the sound was annoying/distracting (SndMEchAnnoy), and how soon the annoyance/distraction occurred (SndMechDistrWithin) and for how long (SndMechDistrFor) the annoyance/distraction continued
(Bldg ID = building identification; Type = statistical analysis performed; Corr = correlation, yellow highlight = significant [p<0.05]; green highlight = moderately significant [0.05<p<0.075]; n/a = not applicable as there were no responses to this question).
Table Q85. Statistical Results in Comparison of Sound Measurements and the Question “I Hear Sounds From Building
Mechanical Equipment In My Work Area” for Building 1.
Variable Type Corr p value
SndMechHear
SndMechHear
SndMechAnnoy
SndMechAnnoy
Pearson
Spearman
Pearson
Spearman
-0.39044
-0.23703
0.403542
0.750366
0.338918
0.571940
0.427545
0.085697
SndMechProdAffect
SndMechProdAffect
SndMechDistrWithin
SndMechDistrWithin
SndMechDistrFor
SndMechDistrFor
Pearson
Spearman
Pearson
Spearman
Pearson
Spearman
0.109134
0.417786
-0.27735
0
-0.69338
-0.86603
0.836948
0.409782
0.821088
1
0.512246
0.333333
Table Q86. Statistical Results in Comparison of Sound Measurements and the Question “I Hear Sounds From Building
Mechanical Equipment In My Work Area” for Building 2.
Variable Type Corr p value
SndMechHear
SndMechHear
SndMechAnnoy
Pearson
Spearman
Pearson
0.645764
0.63796
0.755929
0.117185
0.123159
0.454371
SndMechAnnoy
SndMechProdAffect
SndMechProdAffect
SndMechDistrWithin
SndMechDistrWithin
SndMechDistrFor
SndMechDistrFor
Spearman
Pearson
Spearman
Pearson
Spearman
Pearson
Spearman
0.866025
0.755929
0.866025 n/a n/a n/a n/a
0.333333
0.454371
0.333333 n/a n/a n/a n/a
NCEMBT-080201 389
APPENDIX Q- SOUND LEVEL DATA
Table Q87. Statistical Results in Comparison of Sound Measurements and the Question “I Hear Sounds From Building
Mechanical Equipment In My Work Area” for Building 3.
Variable
SndMechHear
Type
Pearson
Corr
-0.07125 p value
0.808756
SndMechHear
SndMechAnnoy
SndMechAnnoy
SndMechProdAffect
Spearman
Pearson
Spearman
Pearson
-0.05882
-0.08692
-0.05507
0.263547
0.841677
0.824045
0.888102
0.493219
SndMechProdAffect
SndMechDistrWithin
SndMechDistrWithin
SndMechDistrFor
SndMechDistrFor
Spearman
Pearson
Spearman
Pearson
Spearman
0.188982
-0.03432
0.186339
-0.03432
0.186339
0.626283
0.956306
0.764126
0.956306
0.764126
Table Q88. Statistical Results in Comparison of Sound Measurements and the Question “I Hear Sounds From Building
Mechanical Equipment In My Work Area” for Building 4.
Variable Type Corr p value
SndMechHear
SndMechHear
SndMechAnnoy
SndMechAnnoy
SndMechProdAffect
Pearson
Spearman
Pearson
Spearman
Pearson
0.420737
0.408156
0.214155
0.37195
-0.25028
0.092623
0.103857
0.552437
0.289887
0.485540
SndMechProdAffect
SndMechDistrWithin
SndMechDistrWithin
SndMechDistrFor
SndMechDistrFor
Spearman
Pearson
Spearman
Pearson
Spearman
-0.17484
-0.45579
-0.51952
-0.13694
-0.06373
0.629012
0.256372
0.186977
0.746427
0.880836
Table Q89. Statistical Results in Comparison of Sound Measurements and the Question “I Hear Sounds From Building
Mechanical Equipment In My Work Area” for Building 5.
Variable Type Corr p value
SndMechHear
SndMechHear
SndMechAnnoy
SndMechAnnoy
Pearson
Spearman
Pearson
Spearman
0.08242
0.141895
0.5
0.5
0.722461
0.539516
0.666667
0.666667
SndMechProdAffect
SndMechProdAffect
SndMechDistrWithin
SndMechDistrWithin
SndMechDistrFor
SndMechDistrFor
Pearson
Spearman
Pearson
Spearman
Pearson
Spearman
-0.5
-0.5
1
1
-1
-1
0.666667
0.666667
390 NCEMBT-080201
APPENDIX Q- SOUND LEVEL DATA
Table Q90. Statistical Results in Comparison of Sound Measurements and the Question “I Hear Sounds From Building
Mechanical Equipment In My Work Area” for Building 6.
Variable
SndMechHear
Type
Pearson
Corr
-0.07441 p value
0.623112
SndMechHear
SndMechAnnoy
SndMechAnnoy
SndMechProdAffect
Spearman
Pearson
Spearman
Pearson
-0.2853
-0.08453
-0.24456
0.062249
0.054622
0.694534
0.249424
0.772615
SndMechProdAffect
SndMechDistrWithin
SndMechDistrWithin
SndMechDistrFor
SndMechDistrFor
Spearman
Pearson
Spearman
Pearson
Spearman
0.031035
-0.47319
-0.29736
-0.17292
-0.08886
0.885536
0.087462
0.301849
0.554405
0.762584
Table Q91. Statistical Results in Comparison of Sound Measurements and the Question “I Hear Sounds From Building
Mechanical Equipment In My Work Area” for Building 7.
Variable Type Corr p value
SndMechHear
SndMechHear
SndMechAnnoy
SndMechAnnoy
SndMechProdAffect
Pearson
Spearman
Pearson
Spearman
Pearson
0.26055
0.232596
0.124122
0.034143
0.199669
0.009196
0.020516
0.411159
0.821774
0.178432
SndMechProdAffect
SndMechDistrWithin
SndMechDistrWithin
SndMechDistrFor
SndMechDistrFor
Spearman
Pearson
Spearman
Pearson
Spearman
0.111256
-0.11714
-0.18956
0.2476
0.165579
0.456566
0.603666
0.398169
0.266582
0.461484
Table Q92. Statistical Results in Comparison of Sound Measurements and the Question “I Hear Sounds From Building
Mechanical Equipment In My Work Area” for Building 8.
Variable Type Corr p value
SndMechHear
SndMechHear
SndMechAnnoy
SndMechAnnoy
Pearson
Spearman
Pearson
Spearman
-0.19222
-0.20602
0.057599
0
0.228590
0.196266
0.892241
1
SndMechProdAffect
SndMechProdAffect
SndMechDistrWithin
SndMechDistrWithin
SndMechDistrFor
SndMechDistrFor
Pearson
Spearman
Pearson
Spearman
Pearson
Spearman
-0.15785
-0.42524
0.927019
1
0.890361
0.5
0.708913
0.293576
0.244724
0
0.300904
0.666667
NCEMBT-080201 391
APPENDIX Q- SOUND LEVEL DATA
Table Q93. Statistical Results in Comparison of Sound Measurements and the Question “I Hear Sounds From Building
Mechanical Equipment In My Work Area” for Building 9.
Variable
SndMechHear
Type
Pearson
Corr
-0.33454 p value
0.009604
SndMechHear
SndMechAnnoy
SndMechAnnoy
SndMechProdAffect
Spearman
Pearson
Spearman
Pearson
-0.40015
0.298698
0.410143
0.244244
0.001688
0.176918
0.057983
0.273328
SndMechProdAffect
SndMechDistrWithin
SndMechDistrWithin
SndMechDistrFor
SndMechDistrFor
Spearman
Pearson
Spearman
Pearson
Spearman
0.269326
-0.24768
-0.42429
-0.16746
-0.24445
0.225487
0.393243
0.130525
0.567163
0.399639
Table Q94. Statistical Results in Comparison of Sound Measurements and the Question “I Hear Sounds From Building
Mechanical Equipment In My Work Area” for Building 10.
Variable Type Corr p value
SndMechHear
SndMechHear
SndMechAnnoy
SndMechAnnoy
SndMechProdAffect
Pearson
Spearman
Pearson
Spearman
Pearson
0.16175
0.178565
0.029202
-0.07268
0.082061
0.165621
0.125326
0.859922
0.660156
0.619447
SndMechProdAffect
SndMechDistrWithin
SndMechDistrWithin
SndMechDistrFor
SndMechDistrFor
Spearman
Pearson
Spearman
Pearson
Spearman
-0.06468
-0.04984
0.025555
0.385494
0.282503
0.695669
0.808927
0.901380
0.051788
0.162017
392 NCEMBT-080201
APPENDIX Q- SOUND LEVEL DATA
Q23.
S
TATISTICAL
R
ESULTS IN
C
OMPARISON OF
S
OUND
M
EASUREMENTS AND THE
C
AUSE OF
THE M ECHANICAL E QUIPMENT S OUND D ISTRACTION
(Bldg ID = building identification; Type = statistical analysis performed; Corr = correlation, yellow highlight = significant [p<0.05]; green highlight = moderately significant [0.05<p<0.075]; n/a = not applicable as there were no responses to this question).
Table Q95. Statistical Results in Comparison of Sound Measurements and the Cause of the Mechanical Equipment Sound
Distraction for “too loud.”
Bldg ID
1
1
2
Type
Pearson
Spearman
Pearson
Corr
0.160814
0.389742 n/a p value
0.703632
0.339863 n/a
5
6
4
5
3
4
2
3
Spearman
Pearson
Spearman
Pearson
Spearman
Pearson
Spearman
Pearson n/a n/a n/a
0.638476
0.553614
0.046898
-0.01890
0.335497 n/a n/a n/a
0.005808
0.021136
0.840023
0.935198
0.022647
8
9
9
10
7
8
6
7
10
Spearman
Pearson
Spearman
Pearson
Spearman
Pearson
Spearman
Pearson
Spearman
0.334936
0.018193
0.010156
-0.00199
-0.07362
-0.06383
0.011557
-0.07748
-0.02345
0.022889
0.858150
0.920524
0.990144
0.647341
0.630998
0.930772
0.508764
0.841725
NCEMBT-080201 393
APPENDIX Q- SOUND LEVEL DATA
Table Q96. Statistical Results in Comparison of Sound Measurements and the Cause of the Mechanical Equipment Sound
Distraction for “intermittent/unpredictable.”
Bldg ID
1
Type
Pearson
Corr n/a p value n/a
2
3
1
2
Spearman
Pearson
Spearman
Pearson n/a
0.654872
0.812636
0.06472 n/a
0.110406
0.026310
0.826017
6
6
5
5
3
4
4
Spearman
Pearson
Spearman
Pearson
Spearman
Pearson
Spearman
0.083666
-0.28567
-0.36282
0.154991
0.188982
-0.18281
-0.19289
0.776134
0.266348
0.152338
0.502323
0.411972
0.223976
0.199019
9
9
10
10
8
8
7
7
Pearson
Spearman
Pearson
Spearman
Pearson
Spearman
Pearson
Spearman
-0.04522
-0.01408 n/a n/a
0.042951
0.050496
-0.03477
-0.03384
0.656734
0.890017 n/a n/a
0.746695
0.704088
0.767108
0.773167
394 NCEMBT-080201
APPENDIX Q- SOUND LEVEL DATA
Table Q97. Statistical Results in Comparison of Sound Measurements and the Cause of the Mechanical Equipment Sound
Distraction for “increases /decreases.”
Bldg ID Type Corr p value
2
2
1
1
3
Pearson
Spearman
Pearson
Spearman
Pearson
0.186645
0.085049 n/a n/a n/a
0.658083
0.841301 n/a n/a n/a
6
6
5
5
3
4
4
Spearman
Pearson
Spearman
Pearson
Spearman
Pearson
Spearman n/a
0.252997
0.25683 n/a n/a
-0.24742
-0.37225 n/a
0.382829
0.375414 n/a n/a
0.097359
0.010850
9
9
10
10
8
8
7
7
Pearson
Spearman
Pearson
Spearman
Pearson
Spearman
Pearson
Spearman
0.219895
0.190666 n/a n/a
-0.08534
-0.08261 n/a n/a
0.028744
0.058706 n/a n/a
0.520441
0.533927 n/a n/a
Table Q98. Statistical Results in Comparison of Sound Measurements and the Cause of the Mechanical Equipment Sound
Distraction for “understandable.”
Bldg ID
1
1
Type
Pearson
Spearman
Corr n/a n/a p value n/a n/a
3
3
2
2
Pearson
Spearman
Pearson
Spearman n/a n/a n/a n/a n/a n/a n/a n/a
7
7
6
6
5
5
4
4
Pearson
Spearman
Pearson
Spearman
Pearson
Spearman
Pearson
Spearman n/a n/a n/a n/a n/a n/a
-0.02286
-0.03327 n/a n/a n/a n/a n/a n/a
0.822302
0.743726
9
9
8
8
10
10
Pearson
Spearman
Pearson
Spearman
Pearson
Spearman n/a n/a n/a n/a
0.089607
0.098130 n/a n/a n/a n/a
0.444556
0.402264
NCEMBT-080201 395
APPENDIX Q- SOUND LEVEL DATA
Q24.
S
TATISTICAL
R
ESULTS IN
C
OMPARISON OF
S
OUND
M
EASUREMENTS AND THE
Q
UESTION
“I H EAR S OUNDS F ROM A IR D IFFUSER /A IR S UPPLY I N M Y W ORK A REA ”
… (SndAirHear) with follow on questions concerning the sound affecting productivity
(SndAirProdAffect), if the sound was annoying/distracting (SndAirAnnoy), and how soon the annoyance/distraction occurred (SndAirDistrWithin) and for how long (SndAirDistrFor) the annoyance/distraction continued
(Bldg ID = building identification; Type = statistical analysis performed; Corr = correlation, yellow highlight = significant [p<0.05]; green highlight = moderately significant [0.05<p<0.075]; n/a = not applicable as there were no responses to this question).
Table Q99. Statistical Results in Comparison of Sound Measurements and the Question “I Hear Sounds From Air Diffuser/Air
Supply In My Work Area” for Building 1.
Variable Type Corr p value
SndAirHear
SndAirHear
SndAirAnnoy
Pearson
Spearman
Pearson
-0.48089
-0.39491
0.507754
0.227695
0.332923
0.303822
SndAirAnnoy
SndAirProdAffect
SndAirProdAffect
SndAirDistrWithin
SndAirDistrWithin
SndAirDistrFor
SndAirDistrFor
Spearman
Pearson
Spearman
Pearson
Spearman
Pearson
Spearman
0.750366
0.225675
0.417786
-0.27735
0
-0.18898
0
0.085697
0.667234
0.409782
0.821088
1
0.878962
1
Table Q100. Statistical Results in Comparison of Sound Measurements and the Question “I Hear Sounds From Air Diffuser/Air
Supply In My Work Area” for Building 2.
Variable Type Corr p value
SndAirHear
SndAirHear
SndAirAnnoy
Pearson
Spearman
Pearson
0.807769
0.563104
0.755929
0.027974
0.188095
0.454371
SndAirAnnoy
SndAirProdAffect
SndAirProdAffect
SndAirDistrWithin
SndAirDistrWithin
SndAirDistrFor
SndAirDistrFor
Spearman
Pearson
Spearman
Pearson
Spearman
Pearson
Spearman
0.866025
0.5
0.5 n/a n/a n/a n/a
0.333333
0.666667
0.666667 n/a n/a n/a n/a
396 NCEMBT-080201
APPENDIX Q- SOUND LEVEL DATA
Table Q101. Statistical Results in Comparison of Sound Measurements and the Question “I Hear Sounds From Air Diffuser/Air
Supply In My Work Area” for Building 3.
Variable
SndAirHear
Type
Pearson
Corr
-0.30211 p value
0.293823
SndAirHear
SndAirAnnoy
SndAirAnnoy
SndAirProdAffect
Spearman
Pearson
Spearman
Pearson
0.007293
-0.26265
-0.1824
-0.13443
0.980259
0.409510
0.570446
0.677014
SndAirProdAffect
SndAirDistrWithin
SndAirDistrWithin
SndAirDistrFor
SndAirDistrFor
Spearman
Pearson
Spearman
Pearson
Spearman
0.137335
0.210042
0
0.722222
0.740436
0.670384
0.734546
1
0.168229
0.152413
Table Q102. Statistical Results in Comparison of Sound Measurements and the Question “I Hear Sounds From Air Diffuser/Air
Supply In My Work Area” for Building 4.
Variable Type Corr p value
SndAirHear
SndAirHear
SndAirAnnoy
SndAirAnnoy
SndAirProdAffect
Pearson
Spearman
Pearson
Spearman
Pearson
0.227246
0.17218
0.374578
0.286203
0.227141
0.380406
0.508737
0.186990
0.321203
0.434839
SndAirProdAffect
SndAirDistrWithin
SndAirDistrWithin
SndAirDistrFor
SndAirDistrFor
Spearman
Pearson
Spearman
Pearson
Spearman
0.256022
-0.62514
-0.68885
-0.06026
-0.10784
0.376971
0.133299
0.086971
0.897891
0.817983
Table Q103. Statistical Results in Comparison of Sound Measurements and the Question “I Hear Sounds From Air Diffuser/Air
Supply In My Work Area” for Building 5.
Variable Type Corr p value
SndAirHear
SndAirHear
SndAirAnnoy
SndAirAnnoy
Pearson
Spearman
Pearson
Spearman
-0.15536
0.001192
-0.58265
-0.72457
0.501286
0.995908
0.169827
0.065494
SndAirProdAffect
SndAirProdAffect
SndAirDistrWithin
SndAirDistrWithin
SndAirDistrFor
SndAirDistrFor
Pearson
Spearman
Pearson
Spearman
Pearson
Spearman
-0.1913
-0.3118
-1
-1
-1
-1
0.681152
0.496016
NCEMBT-080201 397
APPENDIX Q- SOUND LEVEL DATA
Table Q104. Statistical Results in Comparison of Sound Measurements and the Question “I Hear Sounds From Air Diffuser/Air
Supply In My Work Area” for Building 6.
Variable Type Corr p value
SndAirHear
SndAirHear
SndAirAnnoy
SndAirAnnoy
SndAirProdAffect
Pearson
Spearman
Pearson
Spearman
Pearson
-0.03939
-0.05968
-0.43789
-0.34233
-0.21964
0.794960
0.693595
0.022347
0.080485
0.270994
SndAirProdAffect
SndAirDistrWithin
SndAirDistrWithin
SndAirDistrFor
SndAirDistrFor
Spearman
Pearson
Spearman
Pearson
Spearman
-0.06634
-0.19375
-0.07603
0.050203
-0.02115
0.742335
0.506881
0.796156
0.864667
0.942790
Table Q105. Statistical Results in Comparison of Sound Measurements and the Question “I Hear Sounds From Air Diffuser/Air
Supply In My Work Area” for Building 7.
Variable Type Corr p value
SndAirHear
SndAirHear
SndAirAnnoy
SndAirAnnoy
Pearson
Spearman
Pearson
Spearman
0.060341
0.126698
-0.01155
0.010965
0.552980
0.211424
0.919527
0.923593
SndAirProdAffect
SndAirProdAffect
SndAirDistrWithin
SndAirDistrWithin
SndAirDistrFor
SndAirDistrFor
Pearson
Spearman
Pearson
Spearman
Pearson
Spearman
-0.05457
-0.12944
0.244803
0.290637
0.306384
0.361194
0.635135
0.258702
0.162902
0.095411
0.078010
0.035837
Table Q106. Statistical Results in Comparison of Sound Measurements and the Question “I Hear Sounds From Air Diffuser/Air
Supply In My Work Area” for Building 8.
Variable Type Corr p value
SndAirHear
SndAirHear
SndAirAnnoy
SndAirAnnoy
Pearson
Spearman
Pearson
Spearman
0.095069
0.146682
-0.36332
-0.42204
0.554349
0.360117
0.272087
0.196022
SndAirProdAffect
SndAirProdAffect
SndAirDistrWithin
SndAirDistrWithin
SndAirDistrFor
SndAirDistrFor
Pearson
Spearman
Pearson
Spearman
Pearson
Spearman
-1
-1 n/a n/a n/a n/a
0
0 n/a n/a n/a n/a
398 NCEMBT-080201
APPENDIX Q- SOUND LEVEL DATA
Table Q107. Statistical Results in Comparison of Sound Measurements and the Question “I Hear Sounds From Air Diffuser/Air
Supply In My Work Area” for Building 9.
Variable
SndAirHear
Type
Pearson
Corr
-0.13724 p value
0.299945
SndAirHear
SndAirAnnoy
SndAirAnnoy
SndAirProdAffect
Spearman
Pearson
Spearman
Pearson
-0.25039
-0.36490
-0.10430
-0.15603
0.055787
0.094962
0.644148
0.488064
SndAirProdAffect
SndAirDistrWithin
SndAirDistrWithin
SndAirDistrFor
SndAirDistrFor
Spearman
Pearson
Spearman
Pearson
Spearman
0
-0.40080
-0.43781
0.113938
0.167162
1
0.221864
0.178062
0.753971
0.644381
Table Q108. Statistical Results in Comparison of Sound Measurements and the Question “I Hear Sounds From Air Diffuser/Air
Supply In My Work Area” for Building 10.
Variable Type Corr p value
SndAirHear
SndAirHear
SndAirAnnoy
SndAirAnnoy
SndAirProdAffect
Pearson
Spearman
Pearson
Spearman
Pearson
-0.11287
-0.13795
0.011175
-0.03200
0.017889
0.334990
0.237907
0.926847
0.792589
0.883140
SndAirProdAffect
SndAirDistrWithin
SndAirDistrWithin
SndAirDistrFor
SndAirDistrFor
Spearman
Pearson
Spearman
Pearson
Spearman
0.017696
0.077735
0.142590
0.494135
0.491961
0.884396
0.615985
0.355832
0.000652
0.000694
NCEMBT-080201 399
APPENDIX Q- SOUND LEVEL DATA
Q25.
S
TATISTICAL
R
ESULTS IN
C
OMPARISON OF
S
OUND
M
EASUREMENTS AND THE
C
AUSE OF
THE A IR D IFFUSER /A IR S UPPLY S OUND D ISTRACTION
(Bldg ID = building identification; Type = statistical analysis performed; Corr = correlation, yellow highlight = significant [p<0.05]; green highlight = moderately significant [0.05<p<0.075]; n/a = not applicable as there were no responses to this question).
Table Q109. Statistical Results in Comparison of Sound Measurements and the Cause of the Air Diffuser/Air Supply Sound
Distraction for “too loud.”
Bldg ID
1
1
2
Type
Pearson
Spearman
Pearson
Corr
0.136366
0.425243
0.633148 p value
0.747465
0.293576
0.126919
5
6
4
5
3
4
2
3
Spearman
Pearson
Spearman
Pearson
Spearman
Pearson
Spearman
Pearson
0.524554
-0.03768
0.216025
0.531153
0.500306
-0.03223
-0.0189
-0.32213
0.226767
0.898243
0.458234
0.028237
0.040826
0.889685
0.935198
0.029019
8
9
9
16
7
8
6
7
10
Spearman
Pearson
Spearman
Pearson
Spearman
Pearson
Spearman
Pearson
Spearman
-0.29261
0.097102
0.091024 n/a n/a
-0.18237
-0.20571
-0.18387
-0.14627
0.048455
0.339002
0.370235 n/a n/a
0.166824
0.118037
0.114317
0.210503
400 NCEMBT-080201
APPENDIX Q- SOUND LEVEL DATA
Table Q110. Statistical Results in Comparison of Sound Measurements and the Cause of the Air Diffuser/Air Supply Sound
Distraction for “intermittent/unpredictable.”
Bldg ID Type Corr p value
2
2
1
1
3
Pearson
Spearman
Pearson
Spearman
Pearson
-0.04522
0.129914 n/a n/a
-0.09533
0.915322
0.759138 n/a n/a
0.745798
6
6
5
5
3
4
4
Spearman
Pearson
Spearman
Pearson
Spearman
Pearson
Spearman
0.11007
-0.37334
-0.33892
-0.26114
-0.32127
-0.03687
-0.00338
0.707967
0.139925
0.183273
0.252867
0.155588
0.807790
0.982193
9
9
10
10
8
8
7
7
Pearson
Spearman
Pearson
Spearman
Pearson
Spearman
Pearson
Spearman
-0.11075
-0.10112
-0.00248
0.103575
-0.16941
-0.25253
-0.01249
-0.00322
0.275131
0.319288
0.987715
0.519297
0.199605
0.053653
0.915297
0.978097
Table Q111. Statistical Results in Comparison of Sound Measurements and the Cause of the Air Diffuser/Air Supply Sound
Distraction of “increases/decreases.”
Bldg ID
1
1
Type
Pearson
Spearman
Corr n/a n/a p value n/a n/a
3
3
2
2
Pearson
Spearman
Pearson
Spearman n/a n/a
-0.06357
0.14676 n/a n/a
0.829062
0.616615
7
7
6
6
5
5
4
4
Pearson
Spearman
Pearson
Spearman
Pearson
Spearman
Pearson
Spearman n/a n/a n/a n/a n/a n/a
0.234835
0.190666 n/a n/a n/a n/a n/a n/a
0.019298
0.058706
9
9
8
8
10
10
Pearson
Spearman
Pearson
Spearman
Pearson
Spearman
-0.0371
0
-0.14631
-0.11785
-0.18941
-0.20582
0.817857
1
0.268831
0.374035
0.103622
0.076477
NCEMBT-080201 401
APPENDIX Q- SOUND LEVEL DATA
Table Q112. Statistical Results in Comparison of Sound Measurements and the Cause of the Air Diffuser/Air Supply Sound
Distraction for “understandable.”
Bldg ID Type Corr p value
2
2
1
1
3
Pearson
Spearman
Pearson
Spearman
Pearson n/a n/a
0.613131
0.524554 n/a n/a n/a
0.143175
0.226767 n/a
6
6
5
5
3
4
4
Spearman
Pearson
Spearman
Pearson
Spearman
Pearson
Spearman n/a n/a n/a n/a n/a n/a n/a n/a n/a n/a n/a n/a n/a n/a
9
9
10
10
8
8
7
7
Pearson
Spearman
Pearson
Spearman
Pearson
Spearman
Pearson
Spearman n/a n/a n/a n/a n/a n/a n/a n/a n/a n/a n/a n/a n/a n/a n/a n/a
402 NCEMBT-080201
APPENDIX Q- SOUND LEVEL DATA
Q26.
S
TATISTICAL
R
ESULTS IN
C
OMPARISON OF
S
OUND
M
EASUREMENTS AND THE
Q
UESTION
O F P RIVACY
… (SndPrivLevel) with follow on questions concerning privacy to have a conversation (SndPrivConv) with follow on questions concerning postponing a conversation until later (SndPrivConvLater), leaving the are to gain privacy (SndPrivConvLeave) and having privacy to have a telephone conversation
(SndPrivTel), postponing a telephone conversation until later (SndPrivTelLater),and leaving the are to gain privacy for a telephone conversation (SndPrivTelLeave)
(Bldg ID = building identification; Type = statistical analysis performed; Corr = correlation, yellow highlight = significant [p<0.05]; green highlight = moderately significant [0.05<p<0.075]; n/a = not applicable as there were no responses to this question).
Table Q113. Statistical Results in Comparison of Sound Measurements and the Question Of Privacy for Building 1.
Variable Type Corr p value
SndPrivLevel
SndPrivLevel
SndPrivConv
SndPrivConv
Pearson
Spearman
Pearson
Spearman
0.328148
0.175014
-0.16535
-0.37507
0.427464
0.678489
0.723120
0.407088
SndPrivConvLater
SndPrivConvLater
SndPrivConvLeave
SndPrivConvLeave
SndPrivTel
SndPrivTel
SndPrivTelLater
SndPrivTelLater
SndPrivTelLeave
SndPrivTelLeave
Pearson
Spearman
Pearson
Spearman
Pearson
Spearman
Pearson
Spearman
Pearson
Spearman
0.212542
0.233021
-0.41828
-0.12502
-0.16535
-0.37507
-0.13976
0.098039
-0.30626
0
0.647272
0.615064
0.350358
0.789409
0.723120
0.407088
0.765054
0.834362
0.504119
1
NCEMBT-080201 403
APPENDIX Q- SOUND LEVEL DATA
Table Q114. Statistical Results in Comparison of Sound Measurements and the Question Of Privacy for Building 2.
Variable Type Corr p value
SndPrivLevel
SndPrivLevel
SndPrivConv
SndPrivConv
Pearson
Spearman
Pearson
Spearman
-0.00176
0.115406
-0.01399
0
0.997011
0.805383
0.979019
1
SndPrivConvLater
SndPrivConvLater
SndPrivConvLeave
SndPrivConvLeave
SndPrivTel
SndPrivTel
SndPrivTelLater
SndPrivTelLater
SndPrivTelLeave
SndPrivTelLeave
Pearson
Spearman
Pearson
Spearman
Pearson
Spearman
Pearson
Spearman
Pearson
Spearman
-0.38507
-0.39728
0.24328
0.318182
-0.01399
0
-0.31907
-0.25426
-0.13082
-0.12713
0.450944
0.435437
0.642279
0.538834
0.979019
1
0.537636
0.626833
0.804885
0.810335
Q115. Statistical Results in Comparison of Sound Measurements and the Question Of Privacy for Building 3.
Variable Type Corr p value
SndPrivLevel
SndPrivLevel
SndPrivConv
SndPrivConv
Pearson
Spearman
Pearson
Spearman
0.409317
0.159729
0.428574
0.230685
0.146135
0.585443
0.143969
0.448298
SndPrivConvLater
SndPrivConvLater
SndPrivConvLeave
SndPrivConvLeave
SndPrivTel
SndPrivTel
SndPrivTelLater
SndPrivTelLater
SndPrivTelLeave
SndPrivTelLeave
Pearson
Spearman
Pearson
Spearman
Pearson
Spearman
Pearson
Spearman
Pearson
Spearman
0.235605
0.200928
0.092103
-0.03349
0.460148
0.306028
0.311579
0.341489
-0.10342
-0.25988
0.438401
0.510395
0.764743
0.913514
0.113604
0.309206
0.300058
0.253477
0.736718
0.391190
404 NCEMBT-080201
APPENDIX Q- SOUND LEVEL DATA
Table Q116. Statistical Results in Comparison of Sound Measurements and the Question Of Privacy for Building 4.
Variable Type Corr p value
SndPrivLevel Pearson 0.064150 0.806764
SndPrivLevel
SndPrivConv
SndPrivConv
SndPrivConvLater
Spearman
Pearson
Spearman
Pearson
0.047624
0.011410
-0.0529
0.102503
0.855973
0.969120
0.857464
0.727320
SndPrivConvLater
SndPrivConvLeave
SndPrivConvLeave
SndPrivTel
SndPrivTel
SndPrivTelLater
SndPrivTelLater
SndPrivTelLeave
SndPrivTelLeave
Spearman
Pearson
Spearman
Pearson
Spearman
Pearson
Spearman
Pearson
Spearman
0.054717
-0.37012
-0.36545
0.011410
-0.0529
0.067788
0.059033
-0.33593
-0.32522
0.852617
0.192714
0.198821
0.969120
0.857464
0.817895
0.841119
0.240293
0.256542
Table Q117. Statistical Results in Comparison of Sound Measurements and the Question Of Privacy for Building 5.
Variable Type Corr p value
SndPrivLevel
SndPrivLevel
SndPrivConv
SndPrivConv
Pearson
Spearman
Pearson
Spearman
-0.13251
0.00035
0.09362
0.138858
0.566920
0.998799
0.694625
0.559322
SndPrivConvLater
SndPrivConvLater
SndPrivConvLeave
SndPrivConvLeave
SndPrivTel
SndPrivTel
SndPrivTelLater
SndPrivTelLater
SndPrivTelLeave
SndPrivTelLeave
Pearson
Spearman
Pearson
Spearman
Pearson
Spearman
Pearson
Spearman
Pearson
Spearman
0.044899
0.01292
-0.10646
-0.19057
0.109857
0.197884
0.041974
-0.00782
-0.10523
-0.24973
0.864138
0.960747
0.684242
0.463764
0.644756
0.402986
0.868653
0.975424
0.677727
0.317596
NCEMBT-080201 405
APPENDIX Q- SOUND LEVEL DATA
Table Q118. Statistical Results in Comparison of Sound Measurements and the Question Of Privacy for Building 6.
Variable Type Corr p value
SndPrivLevel Pearson -0.26109 0.079664
SndPrivLevel
SndPrivConv
SndPrivConv
SndPrivConvLater
Spearman
Pearson
Spearman
Pearson
-0.21363
0.205181
0.233396
0.077587
0.154004
0.237041
0.177220
0.667803
SndPrivConvLater
SndPrivConvLeave
SndPrivConvLeave
SndPrivTel
SndPrivTel
SndPrivTelLater
SndPrivTelLater
SndPrivTelLeave
SndPrivTelLeave
Spearman
Pearson
Spearman
Pearson
Spearman
Pearson
Spearman
Pearson
Spearman
-0.01689
-0.11394
-0.1346
0.097924
0.092123
0.027167
-0.06612
-0.05786
-0.06435
0.925659
0.527807
0.455162
0.581660
0.604336
0.876889
0.705908
0.741305
0.713440
Table Q119. Statistical Results in Comparison of Sound Measurements and the Question Of Privacy for Building 7.
Variable Type Corr p value
SndPrivLevel
SndPrivLevel
SndPrivConv
SndPrivConv
Pearson
Spearman
Pearson
Spearman
-0.10217
-0.11596
-0.10261
-0.10782
0.314274
0.253028
0.347149
0.323106
SndPrivConvLater
SndPrivConvLater
SndPrivConvLeave
SndPrivConvLeave
SndPrivTel
SndPrivTel
SndPrivTelLater
SndPrivTelLater
SndPrivTelLeave
SndPrivTelLeave
Pearson
Spearman
Pearson
Spearman
Pearson
Spearman
Pearson
Spearman
Pearson
Spearman
0.033731
0.014141
0.036713
0.046369
-0.0674
-0.07348
0.164269
0.116561
0.066244
0.020497
0.764984
0.900291
0.744883
0.681032
0.537496
0.501335
0.140287
0.297011
0.554317
0.854970
406 NCEMBT-080201
APPENDIX Q- SOUND LEVEL DATA
Table Q120. Statistical Results in Comparison of Sound Measurements and the Question Of Privacy for Building 8.
Variable Type Corr p value
SndPrivLevel Pearson -0.11745 0.464571
SndPrivLevel
SndPrivConv
SndPrivConv
SndPrivConvLater
Spearman
Pearson
Spearman
Pearson
-0.26127
0.206942
-0.06867
-0.35037
0.098947
0.225897
0.690684
0.039069
SndPrivConvLater
SndPrivConvLeave
SndPrivConvLeave
SndPrivTel
SndPrivTel
SndPrivTelLater
SndPrivTelLater
SndPrivTelLeave
SndPrivTelLeave
Spearman
Pearson
Spearman
Pearson
Spearman
Pearson
Spearman
Pearson
Spearman
-0.33175
0.399833
0.18203
0.301929
0.05288
-0.57305
-0.48441
0.386272
0.275742
0.051546
0.017324
0.295299
0.073507
0.759379
0.000321
0.003190
0.021906
0.108863
Table Q121. Statistical Results in Comparison of Sound Measurements and the Question Of Privacy for Building 9.
Variable Type Corr p value
SndPrivLevel
SndPrivLevel
SndPrivConv
SndPrivConv
Pearson
Spearman
Pearson
Spearman
-0.04775
-0.08409
-0.14869
-0.16085
0.719489
0.526618
0.274081
0.236310
SndPrivConvLater
SndPrivConvLater
SndPrivConvLeave
SndPrivConvLeave
SndPrivTel
SndPrivTel
SndPrivTelLater
SndPrivTelLater
SndPrivTelLeave
SndPrivTelLeave
Pearson
Spearman
Pearson
Spearman
Pearson
Spearman
Pearson
Spearman
Pearson
Spearman
-0.08473
-0.09749
0.152198
0.143429
-0.0843
-0.07689
-0.02002
-0.03527
0.1016
0.091456
0.542418
0.483100
0.271914
0.300819
0.536783
0.573262
0.885739
0.800142
0.464760
0.510721
NCEMBT-080201 407
APPENDIX Q- SOUND LEVEL DATA
Table Q122. Statistical Results in Comparison of Sound Measurements and the Question Of Privacy for Building 10.
Variable Type Corr p value
SndPrivLevel Pearson 0.180573 0.121066
SndPrivLevel
SndPrivConv
SndPrivConv
SndPrivConvLater
Spearman
Pearson
Spearman
Pearson
0.199116
0.007445
0.012370
-0.07441
0.086781
0.951587
0.919645
0.555798
SndPrivConvLater
SndPrivConvLeave
SndPrivConvLeave
SndPrivTel
SndPrivTel
SndPrivTelLater
SndPrivTelLater
SndPrivTelLeave
SndPrivTelLeave
Spearman
Pearson
Spearman
Pearson
Spearman
Pearson
Spearman
Pearson
Spearman
-0.06323
-0.20732
-0.18939
0.085310
0.089258
0.020859
0.015418
-0.21229
-0.22089
0.616780
0.097499
0.130790
0.485823
0.465793
0.869001
0.902976
0.089558
0.077020
Q27.
C
UMULATIVE
P
ROBABILITY
D
ATA
Metric
L_99_dBA
L_95_dBA
L_90_dBA
L_80_dBA
L_50_dBA
L_33_dBA
L_10_dBA
L_5_dBA
L_99_dBC
L_95_dBC
L_90_dBC
L_80_dBC
L_50_dBC
L_33_dBC
L_10_dBC
L_5_dBC
L_99_dBC_dBA
L_95_dBC_dBA
L_90_dBC_dBA
L_80_dBC_dBA
Sound level data were compiled in the commonly used metrics listed in Section 3. Cumulative probability levels of that data, without the descriptors, were created so that manageable data tables were available for the correlation analysis.
Table Q123. Cumulative probability sound level by building
Building ID
1 2 3 4 5 6 7 8 9 10
62.4 60.1 54.0 62.1 57.0 61.0 62.5 58.7 61.0 58.2
57.7 56.0 49.3 55.7 52.0 53.5 54.8 53.7 57.1 54.2
54.0 54.0 48.1 53.0 48.9 50.3 52.7 51.3 54.9 52.6
49.8 51.0 47.1 49.9 45.7 47.6 51.2 48.4 53.1 51.3
47.7 48.5 44.8 45.7 40.4 45.1 47.5 42.9 50.8 48.8
46.5 45.6 42.9 44.2 38.2 44.1 46.3 40.1 49.7 47.3
45.0 43.9 40.9 40.8 35.5 42.6 44.2 36.9 48.3 44.9
44.3 43.4 40.5 39.7 34.5 42.2 43.2 34.3 47.8 43.7
69.2 70.3 69.2 68.5 67.9 67.4 72.1 69.9 68.3 68.4
68.0 69.2 68.8 66.7 64.5 65.3 69.9 67.7 66.0 67.5
67.5 68.4 68.5 66.0 63.7 64.7 68.4 66.8 65.2 66.9
66.5 67.0 68.2 65.0 62.9 62.3 67.0 64.9 64.1 66.1
64.7 65.6 65.3 62.8 61.2 58.8 63.8 57.7 61.8 61.3
64.2 64.9 61.4 61.9 60.1 57.6 63.3 55.9 60.9 59.3
62.8 63.1 59.0 60.3 57.1 56.0 62.3 51.3 59.0 56.5
62.0 62.6 58.6 59.6 55.8 55.4 62.0 40.4 58.3 55.5
20.7 22.8 24.5 23.6 29.5 22.5 22.3 29.7 16.0 20.5
19.8 21.7 23.9 22.0 27.7 20.4 21.3 27.4 14.1 18.4
19.2 21.0 23.4 21.3 26.1 18.7 20.6 25.7 13.4 17.3
18.6 20.1 22.7 20.1 24.4 16.7 19.6 22.7 12.5 16.1
408 NCEMBT-080201
L_50_dBC_dBA
L_33_dBC_dBA
L_10_dBC_dBA
L_5_dBC_dBA
L_99_NCMax
L_95_NCMax
L_90_NCMax
L_80_NCMax
L_50_NCMax
L_33_NCMax
L_10_NCMax
L_5_NCMax
L_99_RC
L_95_RC
L_90_RC
L_80_RC
L_50_RC
L_33_RC
L_10_RC
L_5_RC
L_99_SIL
L_95_SIL
L_90_SIL
L_80_SIL
L_50_SIL
L_33_SIL
L_10_SIL
L_5_SIL
APPENDIX Q- SOUND LEVEL DATA
16.9 17.6 19.5 17.1 20.1 13.3 16.8 13.7 11.0 12.9
16.3 16.3 18.3 15.3 16.8 12.2 15.2 10.0 10.1 11.2
12.5 12.7 15.4 10.6 12.1 9.0 11.8 3.7 7.4 8.1
9.6 10.3 13.6 8.5 10.0 7.0 10.4 3.5 6.0 6.6
59.0 56.9 50.2 59.1 53.3 58.2 58.4 55.0 57.7 54.2
53.6 51.8 45.5 52.0 48.2 49.5 50.7 49.5 52.9 49.8
49.6 49.7 44.6 49.0 44.4 45.9 48.4 46.8 50.6 48.2
46.3 46.5 43.6 46.0 40.5 44.3 46.8 43.3 48.6 46.8
44.6 43.3 39.8 40.0 34.6 40.3 42.0 37.0 46.6 43.4
41.8 40.8 36.9 38.4 31.5 38.9 40.4 33.4 44.7 41.6
39.8 38.9 34.7 34.3 27.8 36.0 37.7 29.9 43.7 39.0
39.4 38.3 33.8 33.0 26.5 35.6 36.4 27.2 43.3 37.6
57.4 54.4 47.8 56.7 51.4 54.8 56.9 53.3 55.6 52.8
52.6 50.4 42.6 50.0 46.4 47.6 49.3 48.4 51.7 49.0
48.2 48.3 40.8 47.3 43.2 44.3 47.2 45.9 49.4 47.5
42.4 45.0 39.1 44.3 39.8 41.1 45.7 42.9 47.2 46.1
39.1 42.1 36.6 39.6 34.4 37.3 40.5 36.9 44.3 43.5
38.0 37.7 35.3 37.8 31.7 36.2 39.2 33.6 43.0 42.0
34.2 34.5 31.6 33.1 27.4 34.8 36.3 29.5 41.1 39.4
33.1 33.8 29.3 31.7 25.8 33.9 35.4 27.2 40.4 38.0
55.2 52.5 45.7 54.3 49.8 52.8 55.6 51.3 53.3 50.7
50.3 48.4 40.1 47.7 44.5 45.2 46.7 46.5 49.3 47.0
46.1 46.1 38.3 45.0 41.4 41.9 44.8 44.1 47.1 45.6
40.2 42.8 36.6 42.1 38.1 38.8 43.4 41.3 44.9 44.2
36.7 39.7 34.0 37.3 32.5 34.9 38.5 35.5 41.6 41.7
35.5 35.3 32.8 35.3 29.9 33.9 37.1 32.1 40.2 40.2
31.5 32.2 29.3 30.6 25.9 32.1 34.3 28.0 38.0 37.6
30.3 31.5 27.1 29.0 24.2 31.2 33.3 25.7 37.2 36.3
NCEMBT-080201 409
advertisement
Related manuals

advertisement