advertisement
Debugging
4.6 Using the Memory Monitor
At the last part in this chapter you will use the memory monitor to watch the content at a memory address.
•
Select the Memory tab in the window below.
•
Click on the button Add Memory Monitor.
•
Enter the address of buffer and click on OK.
•
Change the window size.
© PHYTEC Messtechnik GmbH 2006 L-679e_5
97
phyCORE-MPC5200B tiny/IO QuickStart Instructions
•
Click on the Add Rendering Button.
•
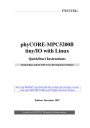
Select ASCII and click on the OK button.
98
You can see the content of the variable buf at the address
0x7fc1fdd8.
© PHYTEC Messtechnik GmbH 2007 L-679e_5
Debugging
•
Next click on the Resume button in the menubar.
The debugger stops at the breakpoint in the line of return.
•
Click on the Resume button to end the application.
You have successfully passed the debugging chapter. You are now able to configure and use Eclipse for remote debugging.
You can step through a project, watch and change the content of variables and you can use the memory monitor to view the content at a memory address.
© PHYTEC Messtechnik GmbH 2006 L-679e_5
99
advertisement
Related manuals
advertisement
Table of contents
- 4 Introduction
- 4 Rapid Development Kit Documentation
- 5 Professional Support Packages available
- 5 Overview of this QuickStart Instruction
- 6 Conventions used in this QuickStart
- 7 System Requirements
- 8 The PHYTEC phyCORE-MPC5200B tiny/IO
- 11 Software Development Toolchains
- 11 Eclipse
- 12 The Gnu Cross Development Toolchain
- 13 Getting Started
- 13 Requirements of the Host Platform
- 14 Configuring the Host Platform
- 14 Installing Software packages
- 20 Setup Network Card Configuration
- 23 Disabling the Firewall
- 24 Setup TFTP-Server
- 26 Linux-PowerPC-Kit Setup
- 36 Connecting the host with the target
- 42 Copying an Example to the Target
- 51 Getting More Involved
- 51 Configuring and Compiling the Kernel
- 55 Writing the Kernel into Flash
- 60 Opening an Existing Project
- 66 Creating a New Project
- 76 Changing the Demo
- 78 Starting a program out of Eclipse on the target
- 82 Starting the program when booting the target
- 87 Debugging an Example Project
- 87 Starting the GDB-Server on the target
- 89 Configuring and starting the debugger in Eclipse
- 94 Setting a breakpoint
- 95 Stepping and Watching Variables Content
- 97 Changing Variables Values
- 99 Using the Memory Monitor
- 102 Further Information
- 103 Summary